Estimated Value: $419,541 - $457,000
3
Beds
1
Bath
1,148
Sq Ft
$384/Sq Ft
Est. Value
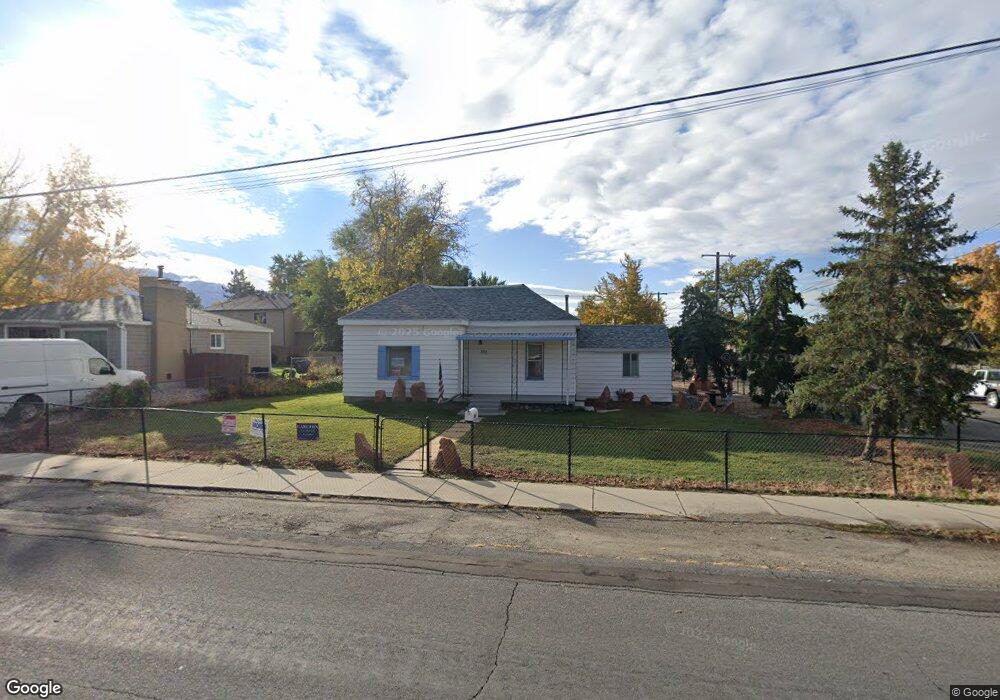
About This Home
This home is located at 588 E 8800 S, Sandy, UT 84070 and is currently estimated at $440,385, approximately $383 per square foot. 588 E 8800 S is a home located in Salt Lake County with nearby schools including Sandy Elementary School, Mount Jordan Middle School, and Jordan High.
Ownership History
Date
Name
Owned For
Owner Type
Purchase Details
Closed on
May 24, 2023
Sold by
Lund Callis T
Bought by
Callis T Lund Living Trust
Current Estimated Value
Home Financials for this Owner
Home Financials are based on the most recent Mortgage that was taken out on this home.
Original Mortgage
$25,000
Outstanding Balance
$24,290
Interest Rate
6.27%
Mortgage Type
Construction
Estimated Equity
$416,095
Purchase Details
Closed on
Oct 14, 2021
Sold by
Lund Callis T
Bought by
Lund Callis T and The Callis T Lund Living Trust
Home Financials for this Owner
Home Financials are based on the most recent Mortgage that was taken out on this home.
Original Mortgage
$228,000
Interest Rate
2.8%
Mortgage Type
New Conventional
Purchase Details
Closed on
Dec 18, 2020
Sold by
Lund Callis Tingey
Bought by
Lund Callis T and The Callis T Lund Living Trust
Create a Home Valuation Report for This Property
The Home Valuation Report is an in-depth analysis detailing your home's value as well as a comparison with similar homes in the area
Home Values in the Area
Average Home Value in this Area
Purchase History
| Date | Buyer | Sale Price | Title Company |
|---|---|---|---|
| Callis T Lund Living Trust | -- | Eagle Gate Title Insurance Agc | |
| Lund Callis T | -- | Eagle Gate Title Insurance Agc | |
| Lund Callis T | -- | Titan Title Ins Agcy Inc | |
| Lund Callis T | -- | Titan Title Ins Agcy Inc | |
| Lund Callis T | -- | None Available |
Source: Public Records
Mortgage History
| Date | Status | Borrower | Loan Amount |
|---|---|---|---|
| Open | Lund Callis T | $25,000 | |
| Previous Owner | Lund Callis T | $228,000 |
Source: Public Records
Tax History Compared to Growth
Tax History
| Year | Tax Paid | Tax Assessment Tax Assessment Total Assessment is a certain percentage of the fair market value that is determined by local assessors to be the total taxable value of land and additions on the property. | Land | Improvement |
|---|---|---|---|---|
| 2025 | $1,744 | $372,200 | $129,000 | $243,200 |
| 2024 | $1,744 | $322,600 | $118,300 | $204,300 |
| 2023 | $1,610 | $296,900 | $112,500 | $184,400 |
| 2022 | $1,723 | $310,400 | $110,300 | $200,100 |
| 2021 | $1,645 | $252,200 | $86,300 | $165,900 |
| 2020 | $1,546 | $223,500 | $86,300 | $137,200 |
| 2019 | $1,374 | $193,600 | $82,000 | $111,600 |
| 2016 | $1,191 | $161,300 | $59,000 | $102,300 |
Source: Public Records
Map
Nearby Homes
- 608 E 8800 S
- 8732 S 620 E
- 8915 S 660 E Unit 103
- 627 E 8680 S
- 8797 Green Way Unit 3
- 8729 S Leafwood Ln
- 8722 S Oakwood Park Cir Unit 8722
- 547 E Pioneer Ave
- 8823 S 300 E
- 354 E 8620 S
- 386 Pioneer Ave
- 807 E Whisper Cove Rd
- 431 E 9150 S
- 744 E 8425 S
- 9083 Enchanted Oak Ln
- 8459 S 300 E
- 9144 S Peach Blossom Dr
- 8322 S Levine Ln Unit 111
- 783 E Newfield Dr Unit 146
- 8643 Vaquero Dr