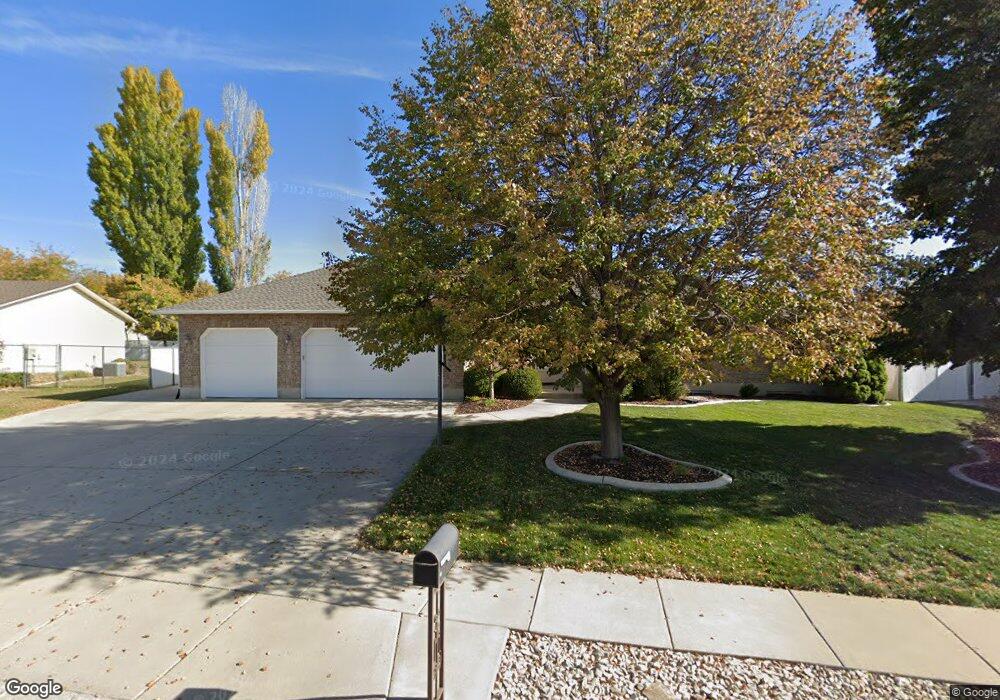
588 N 2400 W Clearfield, UT 84015
Estimated Value: $622,000 - $694,000
--
Bed
4
Baths
2,260
Sq Ft
$295/Sq Ft
Est. Value
About This Home
This home is located at 588 N 2400 W, Clearfield, UT 84015 and is currently estimated at $667,506, approximately $295 per square foot. 588 N 2400 W is a home located in Davis County with nearby schools including Lakeside School, West Point Junior High School, and Syracuse High School.
Ownership History
Date
Name
Owned For
Owner Type
Purchase Details
Closed on
Mar 10, 2021
Sold by
Wayment Alan V and Wayment Kathleen H
Bought by
Wayment Alan V and Wayment Kathleen H
Current Estimated Value
Purchase Details
Closed on
Apr 20, 2005
Sold by
Ward Jeremy D
Bought by
Ward Jeremy D and Ward Laurie L
Home Financials for this Owner
Home Financials are based on the most recent Mortgage that was taken out on this home.
Original Mortgage
$27,600
Interest Rate
5.55%
Mortgage Type
Stand Alone Second
Create a Home Valuation Report for This Property
The Home Valuation Report is an in-depth analysis detailing your home's value as well as a comparison with similar homes in the area
Home Values in the Area
Average Home Value in this Area
Purchase History
| Date | Buyer | Sale Price | Title Company |
|---|---|---|---|
| Wayment Alan V | -- | None Available | |
| Alan And Kathleen Wayment Living Trust | -- | None Listed On Document | |
| Ward Jeremy D | -- | Mountain View Title & Escrow | |
| Ward Jeremy D | -- | Mountain Viewe Title & Escro |
Source: Public Records
Mortgage History
| Date | Status | Borrower | Loan Amount |
|---|---|---|---|
| Previous Owner | Ward Jeremy D | $27,600 | |
| Previous Owner | Ward Jeremy D | $110,400 |
Source: Public Records
Tax History Compared to Growth
Tax History
| Year | Tax Paid | Tax Assessment Tax Assessment Total Assessment is a certain percentage of the fair market value that is determined by local assessors to be the total taxable value of land and additions on the property. | Land | Improvement |
|---|---|---|---|---|
| 2025 | $4,091 | $383,350 | $120,657 | $262,693 |
| 2024 | $3,874 | $364,650 | $108,586 | $256,064 |
| 2023 | $3,609 | $625,000 | $137,838 | $487,162 |
| 2022 | $3,929 | $372,350 | $72,402 | $299,948 |
| 2021 | $3,512 | $498,000 | $110,419 | $387,581 |
| 2020 | $3,109 | $435,000 | $93,250 | $341,750 |
| 2019 | $3,211 | $443,000 | $90,325 | $352,675 |
| 2018 | $3,015 | $410,000 | $89,258 | $320,742 |
| 2016 | $2,750 | $196,790 | $34,583 | $162,207 |
| 2015 | $2,523 | $171,050 | $34,583 | $136,467 |
| 2014 | $2,168 | $149,088 | $34,583 | $114,505 |
| 2013 | -- | $140,318 | $40,921 | $99,397 |
Source: Public Records
Map
Nearby Homes