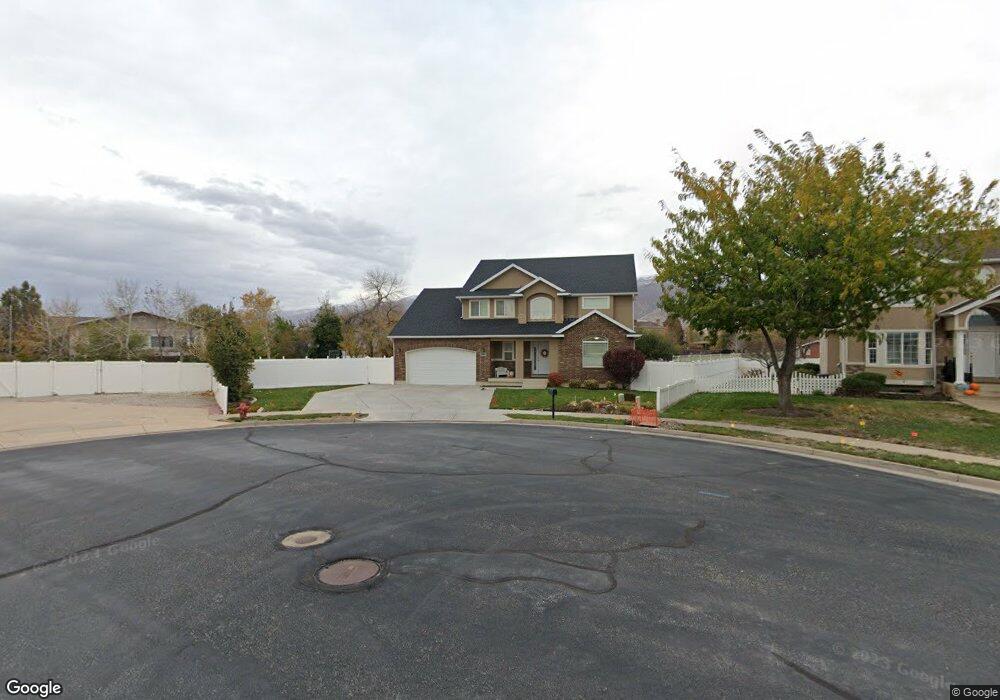
588 N 840 W Unit 17 West Bountiful, UT 84087
Estimated Value: $689,000 - $863,000
4
Beds
3
Baths
2,775
Sq Ft
$272/Sq Ft
Est. Value
About This Home
This home is located at 588 N 840 W Unit 17, West Bountiful, UT 84087 and is currently estimated at $755,917, approximately $272 per square foot. 588 N 840 W Unit 17 is a home located in Davis County with nearby schools including West Bountiful Elementary School, Bountiful Junior High School, and Viewmont High School.
Ownership History
Date
Name
Owned For
Owner Type
Purchase Details
Closed on
Aug 11, 2011
Sold by
First Utah Bank
Bought by
Anderson Mark C and Anderson Kathy G
Current Estimated Value
Purchase Details
Closed on
Oct 7, 2010
Sold by
Reinarz Larry L and Reinarz Marilyn K
Bought by
First Utah Bank
Purchase Details
Closed on
Jan 15, 2009
Sold by
Reinarz Larry L
Bought by
Reinarz Larry L and Reinarz Marilyn K
Purchase Details
Closed on
Jan 17, 1996
Sold by
Evergreen Investments
Bought by
Larry L Reinarz Defined Benefit Plan
Create a Home Valuation Report for This Property
The Home Valuation Report is an in-depth analysis detailing your home's value as well as a comparison with similar homes in the area
Home Values in the Area
Average Home Value in this Area
Purchase History
| Date | Buyer | Sale Price | Title Company |
|---|---|---|---|
| Anderson Mark C | -- | Executive Title Ins A | |
| First Utah Bank | -- | First American Title Ncs | |
| Reinarz Larry L | -- | First American Title Ncs | |
| Reinarz Larry L | -- | None Available | |
| Larry L Reinarz Defined Benefit Plan | -- | Security Title Company | |
| Evergreen Investments | -- | Security Title Company |
Source: Public Records
Tax History Compared to Growth
Tax History
| Year | Tax Paid | Tax Assessment Tax Assessment Total Assessment is a certain percentage of the fair market value that is determined by local assessors to be the total taxable value of land and additions on the property. | Land | Improvement |
|---|---|---|---|---|
| 2025 | $3,871 | $336,050 | $161,056 | $174,994 |
| 2024 | $3,617 | $321,750 | $132,855 | $188,895 |
| 2023 | $3,596 | $589,000 | $248,385 | $340,615 |
| 2022 | $3,643 | $333,850 | $121,483 | $212,367 |
| 2021 | $3,457 | $487,000 | $168,316 | $318,684 |
| 2020 | $3,117 | $434,000 | $152,682 | $281,318 |
| 2019 | $3,133 | $432,000 | $151,332 | $280,668 |
| 2018 | $2,884 | $391,000 | $147,443 | $243,557 |
| 2016 | $2,504 | $184,030 | $42,656 | $141,374 |
| 2015 | $2,437 | $170,390 | $42,656 | $127,734 |
| 2014 | $2,258 | $162,250 | $42,656 | $119,594 |
| 2013 | -- | $146,240 | $44,000 | $102,240 |
Source: Public Records
Map
Nearby Homes
- 767 W 220 N
- 280 N 1100 W
- 825 W 1320 N
- 340 N 500 W Unit 204
- 790 N 500 W
- 680 W 500 S Unit 22
- 680 W 500 S Unit 17
- 399 W 400 N Unit 47
- 366 W 1000 N
- 637 W 1600 N
- 1084 W Audrey Ln Unit 20
- 1084 W Audrey Ln
- 167 S 425 W
- 314 W Center St Unit D135
- 314 W Center St Unit D159
- 314 W Center St Unit E150
- 499 N 200 W Unit 30
- 499 N 200 W Unit 19
- 155 N Peregrine Ln W
- 553 N 200 W