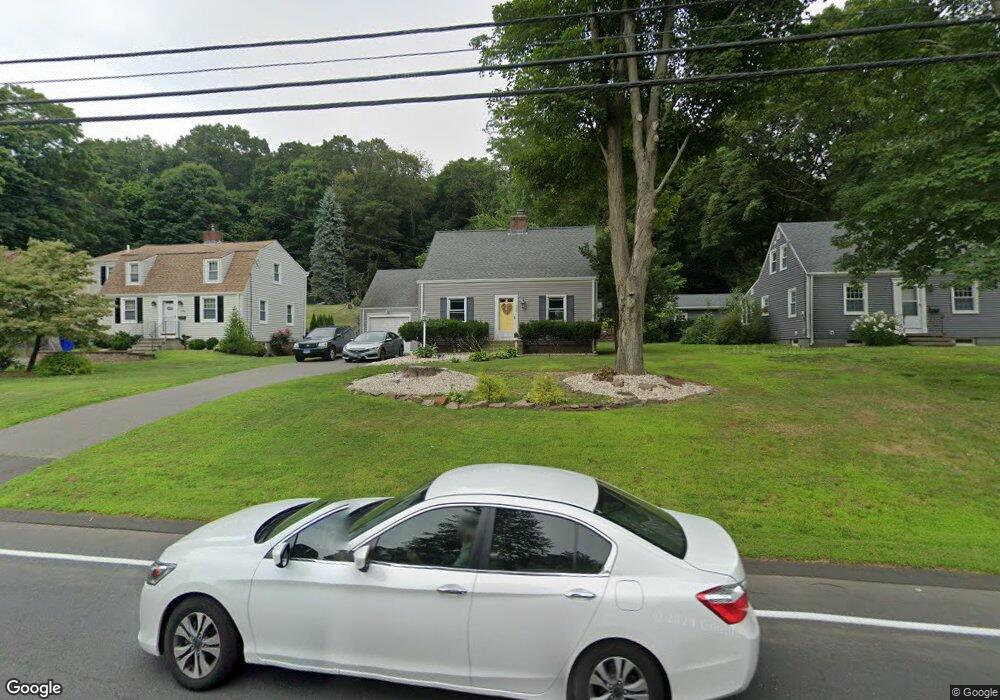
588 Old Main St Rocky Hill, CT 06067
Estimated Value: $317,000 - $390,000
2
Beds
2
Baths
1,155
Sq Ft
$314/Sq Ft
Est. Value
About This Home
This home is located at 588 Old Main St, Rocky Hill, CT 06067 and is currently estimated at $363,238, approximately $314 per square foot. 588 Old Main St is a home located in Hartford County with nearby schools including Albert D. Griswold Middle School, Rocky Hill High School, and Corpus Christi School.
Ownership History
Date
Name
Owned For
Owner Type
Purchase Details
Closed on
Aug 10, 2018
Sold by
Rivera-Jeffery Vivian M and Rivera-Jeffery Jeffery Robert
Bought by
Datiz Marisol
Current Estimated Value
Home Financials for this Owner
Home Financials are based on the most recent Mortgage that was taken out on this home.
Original Mortgage
$221,906
Outstanding Balance
$192,716
Interest Rate
4.5%
Mortgage Type
FHA
Estimated Equity
$170,522
Purchase Details
Closed on
Sep 30, 2005
Sold by
Rodko Lydia L
Bought by
Jeffrey Robert B and Rivera Vivian M
Home Financials for this Owner
Home Financials are based on the most recent Mortgage that was taken out on this home.
Original Mortgage
$202,500
Interest Rate
5.84%
Purchase Details
Closed on
May 22, 1998
Sold by
Magaldi Cara R
Bought by
Rodko Lydia L
Create a Home Valuation Report for This Property
The Home Valuation Report is an in-depth analysis detailing your home's value as well as a comparison with similar homes in the area
Home Values in the Area
Average Home Value in this Area
Purchase History
| Date | Buyer | Sale Price | Title Company |
|---|---|---|---|
| Datiz Marisol | $226,000 | -- | |
| Jeffrey Robert B | $225,000 | -- | |
| Rodko Lydia L | $97,000 | -- | |
| Jeffrey Robert B | $225,000 | -- | |
| Rodko Lydia L | $97,000 | -- |
Source: Public Records
Mortgage History
| Date | Status | Borrower | Loan Amount |
|---|---|---|---|
| Open | Datiz Marisol | $221,906 | |
| Previous Owner | Rodko Lydia L | $181,000 | |
| Previous Owner | Rodko Lydia L | $202,500 |
Source: Public Records
Tax History Compared to Growth
Tax History
| Year | Tax Paid | Tax Assessment Tax Assessment Total Assessment is a certain percentage of the fair market value that is determined by local assessors to be the total taxable value of land and additions on the property. | Land | Improvement |
|---|---|---|---|---|
| 2025 | $5,692 | $188,230 | $67,060 | $121,170 |
| 2024 | $5,491 | $188,230 | $67,060 | $121,170 |
| 2023 | $5,562 | $154,840 | $66,220 | $88,620 |
| 2022 | $5,345 | $154,840 | $66,220 | $88,620 |
| 2021 | $5,280 | $154,840 | $66,220 | $88,620 |
| 2020 | $5,203 | $154,840 | $66,220 | $88,620 |
| 2019 | $5,032 | $154,840 | $66,220 | $88,620 |
| 2018 | $4,575 | $141,190 | $59,570 | $81,620 |
| 2017 | $4,462 | $141,190 | $59,570 | $81,620 |
| 2016 | $4,377 | $141,190 | $59,570 | $81,620 |
| 2015 | $4,193 | $141,190 | $59,570 | $81,620 |
| 2014 | $4,193 | $141,190 | $59,570 | $81,620 |
Source: Public Records
Map
Nearby Homes
- 71 Joiners Rd
- 2245 Silas Deane Hwy
- 18 Colonial Dr Unit A
- 59 Chapin Ave
- 1610 Silas Deane Hwy
- 88 Elm St
- 507 Cedar Hollow Dr
- 15 Marshall Rd
- 40 Grimes Rd
- 102 Brookwood Dr Unit D
- 71 Brookwood Dr Unit D
- 431 Elm St
- 32 Jennifers Way
- 37 Carillon Dr Unit A
- 32 Wright Rd
- 37 Deming Rd
- 2843 Main St
- 89 Gilbert Ave
- 215 Dug Rd
- 7 Pearl Ln
- 582 Old Main St
- 594 Old Main St
- 576 Old Main St
- 602 Old Main St
- 568 Old Main St
- 585 Old Main St
- 610 Old Main St
- 612 Old Main St
- 560 Old Main St
- 618 Old Main St
- 561 Old Main St
- 597 Old Main St
- 577 Old Main St
- 2 Church St
- 626 Old Main St
- 559 Old Main St
- 4 Church St
- 542 Old Main St
- 549 Old Main St
- 636 Old Main St