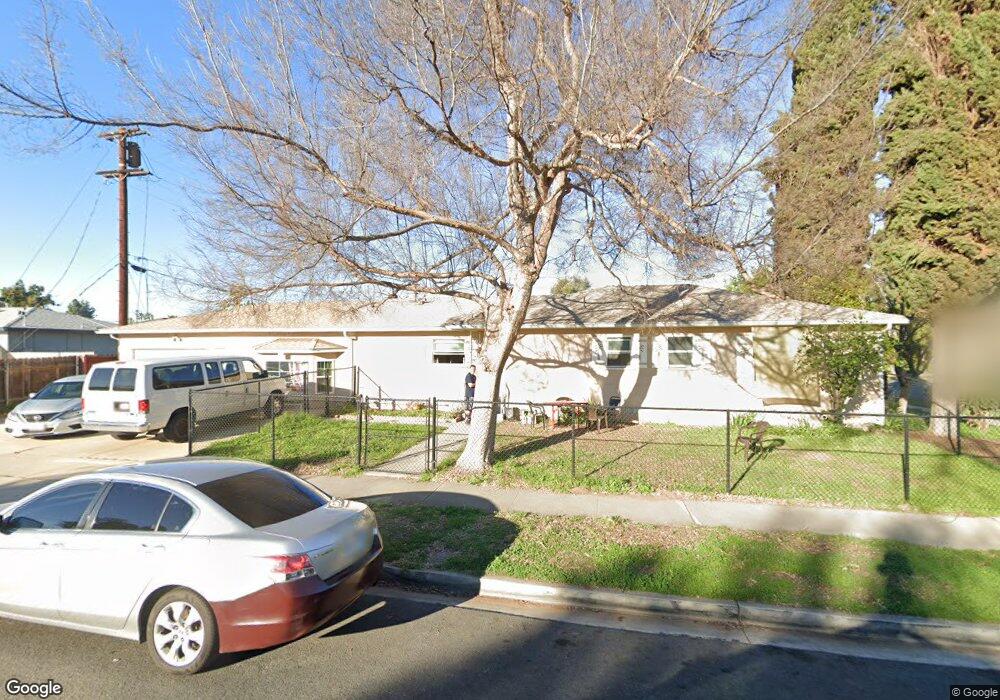
588 Roberta Ave El Cajon, CA 92021
El Cajon AreaEstimated Value: $800,478 - $831,000
About This Home
This home is located at 588 Roberta Ave, El Cajon, CA 92021 and is currently estimated at $812,120, approximately $453 per square foot. 588 Roberta Ave is a home located in San Diego County with nearby schools including Naranca Elementary School, Cajon Valley Middle School, and El Cajon Valley High School.
Ownership History
We collect this data history from publicly available records. To have your information removed, we recommend requesting removal directly through your county’s website.
Purchase Details
Home Financials for this Owner
Home Financials are based on the most recent Mortgage that was taken out on this home.Purchase Details
Purchase History
We collect this data history from publicly available records. To have your information removed, we recommend requesting removal directly through your county’s website.
| Date | Buyer | Sale Price | Title Company |
|---|---|---|---|
| $320,000 | Fidelity National Title | ||
| -- | -- |
Mortgage History
We collect this data history from publicly available records. To have your information removed, we recommend requesting removal directly through your county’s website.
| Date | Status | Borrower | Loan Amount |
|---|---|---|---|
| Open | $309,000 | ||
| Previous Owner | $288,000 |
Tax History
We collect this data history from publicly available records. To have your information removed, we recommend requesting removal directly through your county’s website.
| Year | Tax Paid | Tax Assessment Tax Assessment Total Assessment is a certain percentage of the fair market value that is determined by local assessors to be the total taxable value of land and additions on the property. | Land | Improvement |
|---|---|---|---|---|
| 2026 | $1,955 | $420,305 | $157,612 | $262,693 |
| 2025 | $1,440 | $412,065 | $154,522 | $257,543 |
| 2024 | $1,440 | $403,987 | $151,493 | $252,494 |
| 2023 | $1,887 | $396,067 | $148,523 | $247,544 |
| 2022 | $1,678 | $388,302 | $145,611 | $242,691 |
| 2021 | $1,559 | $380,689 | $142,756 | $237,933 |
| 2020 | $1,239 | $376,787 | $141,293 | $235,494 |
| 2019 | $42 | $369,400 | $138,523 | $230,877 |
| 2018 | $42 | $362,157 | $135,807 | $226,350 |
| 2017 | $41 | $355,057 | $133,145 | $221,912 |
| 2016 | $39 | $348,096 | $130,535 | $217,561 |
| 2015 | $39 | $342,869 | $128,575 | $214,294 |
| 2014 | $40 | $336,154 | $126,057 | $210,097 |
Map
- 503 N 1st St Unit 50B
- 1223 Coral St
- 532 N 1st St
- 1278 Oakdale Ave
- 540 Oakdale Ln Unit K
- 559 Oakdale Ln Unit C
- 513 Shady Ln Unit B
- 1263 Oakdale Ave
- 340 Orlando St
- 1174 E Main St Unit 31
- 1174 E Main St Unit 139
- 1174 E Main St Unit 74
- 1174 E Main St Unit 63
- 1174 E Main St Unit 173
- 1174 E Main St Unit 103
- 1174 E Main St Unit 135
- 1174 E Main St Unit 148
- 1174 E Main St Unit 113
- 1174 E Main St Unit 120
- 1045 Peach Ave Unit 50
- 1156 Deem Place
- 1150 Deem Place
- 570 Roberta Ave
- 1155 Evilo St
- 1149 Evilo St
- 1144 Deem Place
- 1155 Deem Place
- 544 Roberta Ave
- 1151 Deem Place
- 1143 Evilo St
- 1138 Deem Place
- 579 Roberta Ave
- 567 Roberta Ave
- 1143 Deem Place
- 1137 Deem Place
- 585 Roberta Ave
- 1137 Evilo St
- 555 Roberta Ave
- 538 Roberta Ave
- 1173 Evilo St
Ask me questions while you tour the home.