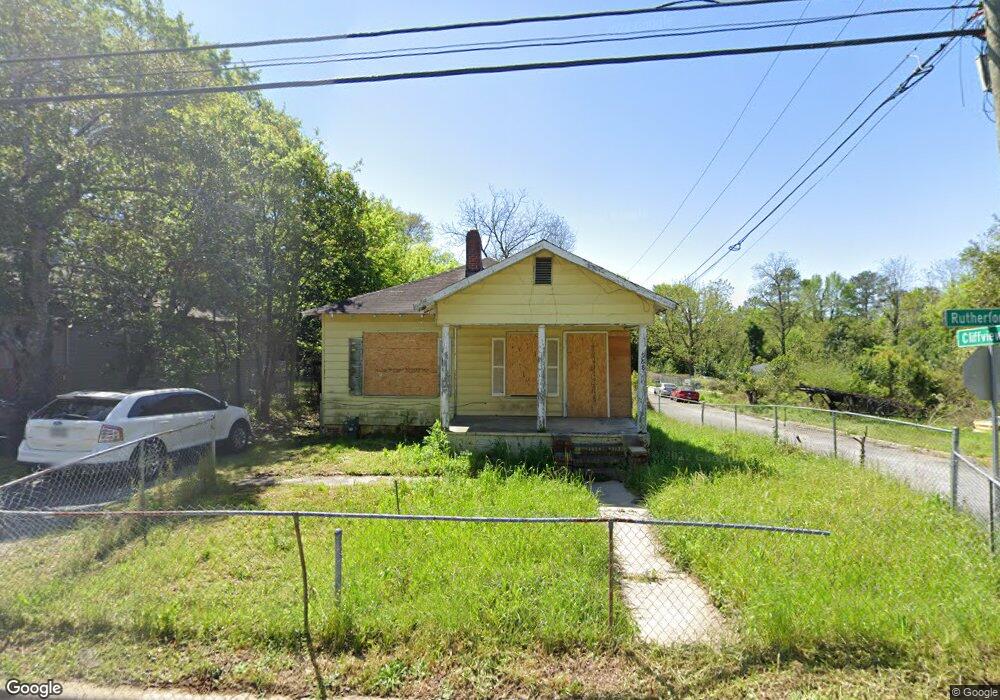
588 Rutherford Ave Macon, GA 31206
Estimated Value: $44,000 - $65,000
3
Beds
1
Bath
1,058
Sq Ft
$52/Sq Ft
Est. Value
About This Home
This home is located at 588 Rutherford Ave, Macon, GA 31206 and is currently estimated at $55,065, approximately $52 per square foot. 588 Rutherford Ave is a home located in Bibb County with nearby schools including Ingram-Pye Elementary School, Southwest High School, and Cirrus Charter Academy.
Ownership History
Date
Name
Owned For
Owner Type
Purchase Details
Closed on
Jan 8, 2021
Sold by
Bader Midnal Jerome
Bought by
Copindean Oliviu
Current Estimated Value
Purchase Details
Closed on
Dec 22, 2020
Sold by
Baxter Michial Jerome
Bought by
Copindean Oliviu
Purchase Details
Closed on
Dec 18, 2020
Sold by
Fetal Equtt Llc
Bought by
Baxter Michisi Jerome
Purchase Details
Closed on
Feb 8, 2013
Sold by
State Bank And Trust Co
Bought by
Total Equity Llc
Purchase Details
Closed on
Apr 3, 2012
Sold by
Rutherford Avenue 588 Land Trust
Bought by
State Bank & Trust Company
Purchase Details
Closed on
Nov 29, 2007
Sold by
Cooling Ernest N
Bought by
Rutherford Avenue 588 Land Trust and Tqm Resources Llc
Purchase Details
Closed on
Jul 18, 2007
Sold by
Evans Billy Charles
Bought by
Cooling Ernest N
Purchase Details
Closed on
Jun 3, 2005
Sold by
Hammack Helen C
Bought by
Evans Billy Charles
Create a Home Valuation Report for This Property
The Home Valuation Report is an in-depth analysis detailing your home's value as well as a comparison with similar homes in the area
Purchase History
| Date | Buyer | Sale Price | Title Company |
|---|---|---|---|
| Copindean Oliviu | $2,000 | Jenkins Title Llc | |
| Copindean Oliviu | $2,000 | None Listed On Document | |
| Baxter Michisi Jerome | -- | Jenkins Title Llc | |
| Baxter Michial Jerome | -- | Jenkins Title | |
| Total Equity Llc | $660 | None Available | |
| State Bank & Trust Company | $3,000 | None Available | |
| Rutherford Avenue 588 Land Trust | $7,000 | None Available | |
| Cooling Ernest N | -- | None Available | |
| Evans Billy Charles | -- | None Avilebel |
Source: Public Records
Tax History
| Year | Tax Paid | Tax Assessment Tax Assessment Total Assessment is a certain percentage of the fair market value that is determined by local assessors to be the total taxable value of land and additions on the property. | Land | Improvement |
|---|---|---|---|---|
| 2025 | $239 | $9,745 | $2,400 | $7,345 |
| 2024 | $248 | $9,745 | $2,400 | $7,345 |
| 2023 | $161 | $8,041 | $1,600 | $6,441 |
| 2022 | $119 | $4,633 | $1,849 | $2,784 |
| 2021 | $30 | $800 | $255 | $545 |
| 2020 | $109 | $2,799 | $891 | $1,908 |
| 2019 | $102 | $2,604 | $838 | $1,766 |
| 2018 | $336 | $2,604 | $838 | $1,766 |
| 2017 | $98 | $2,604 | $838 | $1,766 |
| 2016 | $139 | $4,021 | $838 | $3,183 |
| 2015 | $225 | $4,588 | $838 | $3,749 |
| 2014 | $5 | $4,588 | $838 | $3,749 |
Source: Public Records
Map
Nearby Homes
- 579 Rutherford Ave
- 622 Cleveland St
- 537 Rutherford Ave
- 2890 Bacon St
- 2920 Houston Ave
- 538 Cleveland St
- 534 Hanson St
- 554 Nelson St
- 648 Hightower Rd
- 2872 Antioch Rd
- 532 Nelson St
- 780 Ponce de Leon Ave
- 578 Robert Henry St
- 586 Robert Henry St
- 534 Robert Henry St
- 3402 Antioch Rd
- 2752 Antioch Rd
- 678 Dixie Ave
- 823 Ponce de Leon Ave
- 837 Lackey Dr
- 584 Rutherford Ave
- 580 Rutherford Ave
- 604 Cliffview Dr
- 605 Cliffview Dr
- 522 Rutherford Ave
- 606 Rutherford Ave
- 574 Rutherford Ave
- 2986 Bacon St
- 614 Rutherford Ave
- 568 Rutherford Ave
- 613 Rutherford Ave
- 613 Rutherford Ave Unit 13
- 638 Rutherford Ave
- 2962 Bacon St
- 562 Rutherford Ave
- 2961 Bacon St
- 635 Rutherford Ave
- 556 Rutherford Ave
- 641 Rutherford Ave
- 607 Cliffview Dr
Your Personal Tour Guide
Ask me questions while you tour the home.