Estimated Value: $345,000 - $351,000
3
Beds
1
Bath
1,620
Sq Ft
$215/Sq Ft
Est. Value
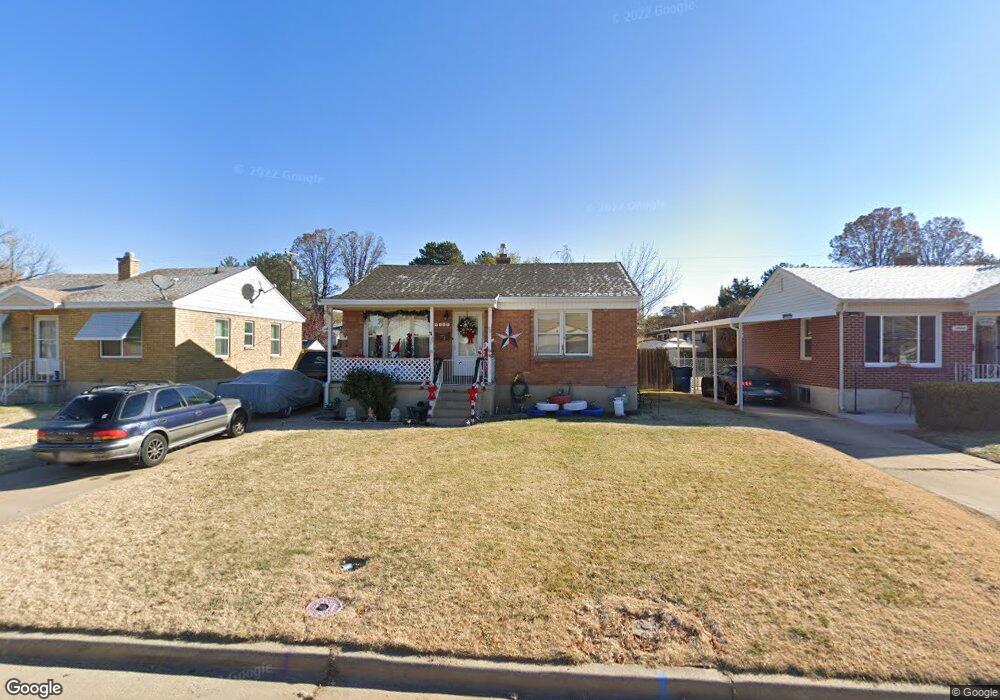
About This Home
This home is located at 5880 S 2600 W, Roy, UT 84067 and is currently estimated at $347,947, approximately $214 per square foot. 5880 S 2600 W is a home located in Weber County with nearby schools including Municipal School, Roy Junior High School, and Roy High School.
Ownership History
Date
Name
Owned For
Owner Type
Purchase Details
Closed on
Apr 30, 2009
Sold by
Shurtleff Kristopher L and Shurtleff Jamie
Bought by
Shurtleff Kristopher L and Shurtleff Jamie
Current Estimated Value
Home Financials for this Owner
Home Financials are based on the most recent Mortgage that was taken out on this home.
Original Mortgage
$125,661
Outstanding Balance
$79,992
Interest Rate
4.99%
Mortgage Type
FHA
Estimated Equity
$267,955
Purchase Details
Closed on
Jul 12, 2005
Sold by
Svoboda Robert G and Svoboda Phillis D
Bought by
Shurtleff Kristopher L and Shurtleff Jaime
Create a Home Valuation Report for This Property
The Home Valuation Report is an in-depth analysis detailing your home's value as well as a comparison with similar homes in the area
Home Values in the Area
Average Home Value in this Area
Purchase History
| Date | Buyer | Sale Price | Title Company |
|---|---|---|---|
| Shurtleff Kristopher L | -- | Bonneville Superior Title Co | |
| Shurtleff Kristopher L | -- | Equity Title |
Source: Public Records
Mortgage History
| Date | Status | Borrower | Loan Amount |
|---|---|---|---|
| Open | Shurtleff Kristopher L | $125,661 |
Source: Public Records
Tax History
| Year | Tax Paid | Tax Assessment Tax Assessment Total Assessment is a certain percentage of the fair market value that is determined by local assessors to be the total taxable value of land and additions on the property. | Land | Improvement |
|---|---|---|---|---|
| 2025 | $1,990 | $304,254 | $95,215 | $209,039 |
| 2024 | $1,925 | $162,799 | $52,376 | $110,423 |
| 2023 | $1,795 | $151,250 | $53,638 | $97,612 |
| 2022 | $2,026 | $179,300 | $49,858 | $129,442 |
| 2021 | $1,433 | $237,000 | $58,268 | $178,732 |
| 2020 | $1,248 | $189,000 | $58,268 | $130,732 |
| 2019 | $1,196 | $171,000 | $34,683 | $136,317 |
| 2018 | $999 | $135,000 | $30,008 | $104,992 |
| 2017 | $927 | $118,000 | $30,008 | $87,992 |
| 2016 | $918 | $63,031 | $17,228 | $45,803 |
| 2015 | $818 | $57,928 | $19,813 | $38,115 |
| 2014 | $762 | $53,339 | $14,630 | $38,709 |
Source: Public Records
Map
Nearby Homes
Your Personal Tour Guide
Ask me questions while you tour the home.