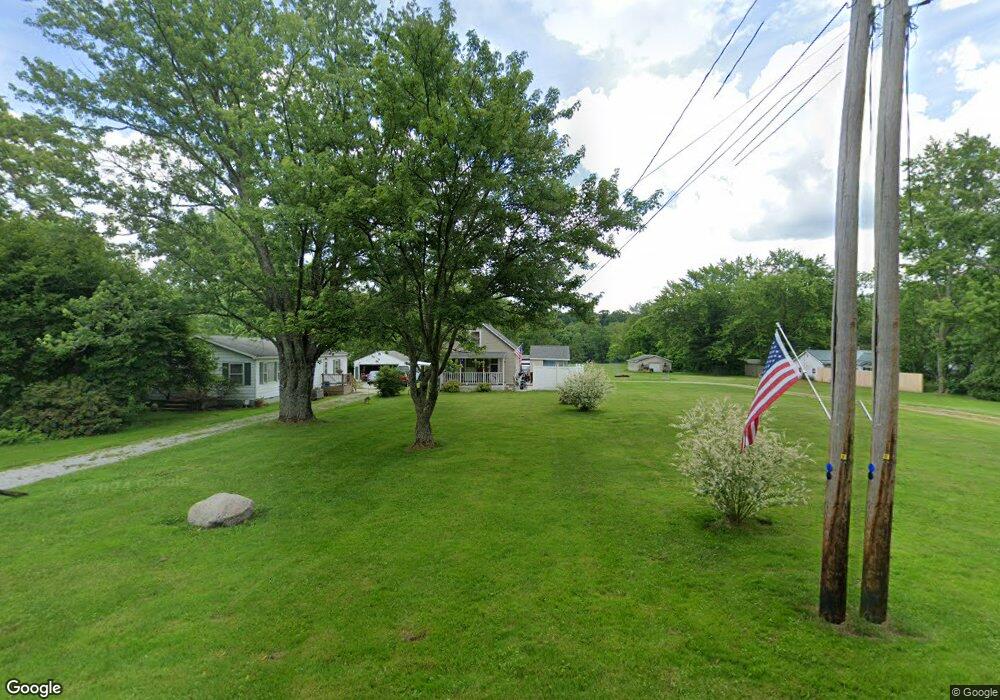
5881 Grove Rd New Franklin, OH 44216
Estimated Value: $197,981 - $273,000
3
Beds
1
Bath
888
Sq Ft
$264/Sq Ft
Est. Value
About This Home
This home is located at 5881 Grove Rd, New Franklin, OH 44216 and is currently estimated at $233,995, approximately $263 per square foot. 5881 Grove Rd is a home located in Summit County with nearby schools including St. Francis de Sales School.
Ownership History
Date
Name
Owned For
Owner Type
Purchase Details
Closed on
Sep 25, 2023
Sold by
Wise Steven J
Bought by
Wise Steven J and Wise Frank Marion
Current Estimated Value
Purchase Details
Closed on
Sep 22, 2023
Sold by
Frank Marion K
Bought by
Wise Steven J and Wise Frank Marion
Purchase Details
Closed on
Sep 13, 2001
Sold by
Wise Steven J and Wise Michelle R
Bought by
Wise Steven J
Home Financials for this Owner
Home Financials are based on the most recent Mortgage that was taken out on this home.
Original Mortgage
$107,100
Interest Rate
7.03%
Purchase Details
Closed on
Jul 9, 1999
Sold by
Family Investment Properties Llc
Bought by
Wise Steven J and Wise Michelle R
Home Financials for this Owner
Home Financials are based on the most recent Mortgage that was taken out on this home.
Original Mortgage
$71,200
Interest Rate
8%
Purchase Details
Closed on
May 5, 1999
Sold by
Simpson Christopher R
Bought by
Family Investment Properties Llc and Tucker Land Management Llc
Create a Home Valuation Report for This Property
The Home Valuation Report is an in-depth analysis detailing your home's value as well as a comparison with similar homes in the area
Home Values in the Area
Average Home Value in this Area
Purchase History
| Date | Buyer | Sale Price | Title Company |
|---|---|---|---|
| Wise Steven J | -- | None Listed On Document | |
| Wise Steven J | -- | None Listed On Document | |
| Wise Steven J | -- | None Listed On Document | |
| Wise Steven J | -- | Guardian Title | |
| Wise Steven J | $89,900 | Midland Commerce Group | |
| Family Investment Properties Llc | $38,000 | Midland Commerce Group |
Source: Public Records
Mortgage History
| Date | Status | Borrower | Loan Amount |
|---|---|---|---|
| Previous Owner | Wise Steven J | $107,100 | |
| Previous Owner | Wise Steven J | $71,200 | |
| Closed | Wise Steven J | $17,980 |
Source: Public Records
Tax History Compared to Growth
Tax History
| Year | Tax Paid | Tax Assessment Tax Assessment Total Assessment is a certain percentage of the fair market value that is determined by local assessors to be the total taxable value of land and additions on the property. | Land | Improvement |
|---|---|---|---|---|
| 2025 | $2,446 | $48,965 | $11,480 | $37,485 |
| 2024 | $2,446 | $48,965 | $11,480 | $37,485 |
| 2023 | $929 | $17,343 | $15,271 | $2,072 |
| 2022 | $885 | $13,468 | $11,396 | $2,072 |
| 2021 | $2,372 | $36,838 | $8,568 | $28,270 |
| 2020 | $873 | $36,840 | $8,570 | $28,270 |
| 2019 | $1,145 | $31,870 | $11,100 | $20,770 |
| 2018 | $925 | $31,870 | $11,100 | $20,770 |
| 2017 | $2,045 | $31,870 | $11,100 | $20,770 |
| 2016 | $1,009 | $30,430 | $11,100 | $19,330 |
| 2015 | $2,045 | $30,430 | $11,100 | $19,330 |
| 2014 | $2,030 | $30,430 | $11,100 | $19,330 |
| 2013 | $1,847 | $27,820 | $11,100 | $16,720 |
Source: Public Records
Map
Nearby Homes
- 6090 Manchester Rd Unit 6096
- 781 Leeman Dr
- 6387 Hampsher Rd
- 2536 Emmons Dr
- 715 Highland Park Dr
- 4851 Manchester Rd
- 4698 Manchester Rd
- 2457 Bishop Oval
- 6270 Pinto Dr
- 0 Grill Rd
- 7452 S Cleveland Massillon Rd
- 5239 Monroe Square E
- V/L Monroe Square
- V/L Bishop Oval
- 4567 Rex Lake Dr
- 2200 W Comet Rd
- 1850 Turkeyfoot Lake Rd
- 5983 Weaver Rd
- 3241 Grill Rd
- 451 Yager Rd
- 5875 Grove Rd
- 5895 Grove Rd
- 5909 Grove Rd
- 5868 Grove Rd
- 5900 Grove Rd
- 5857 Grove Rd
- 5885 Grove Rd
- 5871 Grove Rd
- 5923 Grove Rd
- 5933 Grove Rd
- 5829 Grove Rd
- 1678 Limbach Rd
- 5936 Grove Rd
- 1690 Limbach Rd
- 1690 Limbach Parcel B
- 5969 Grove Rd
- 1702 Limbach Rd
- 1702 Limbach Parcel C
- 5818 Grove Rd
- 5797 Grove Rd