Estimated Value: $269,856 - $352,000
3
Beds
3
Baths
2,004
Sq Ft
$160/Sq Ft
Est. Value
About This Home
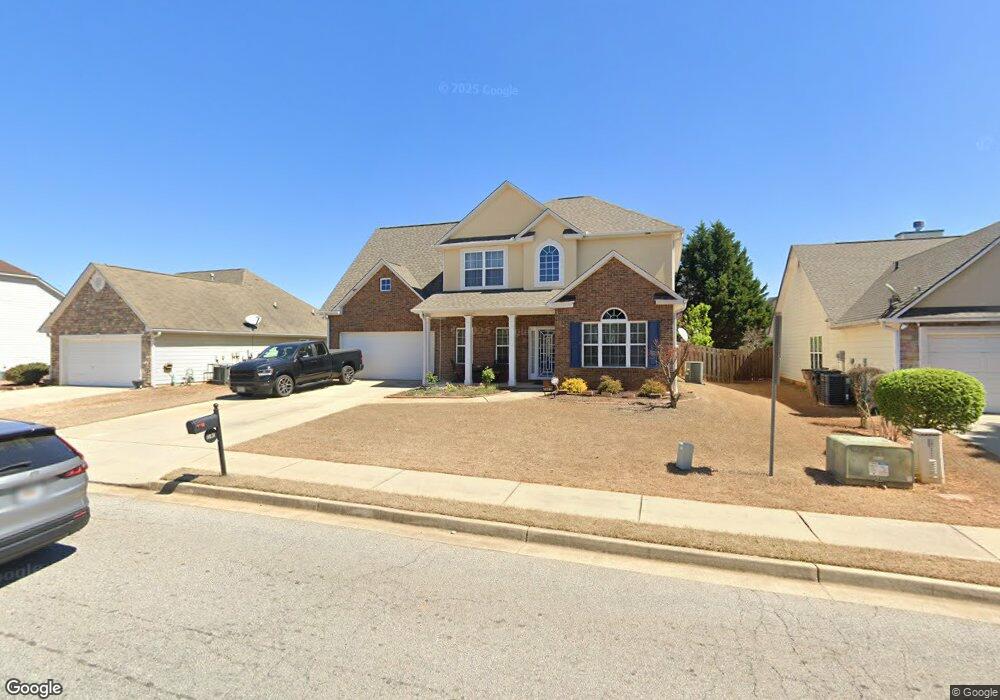
This home is located at 5882 Rex Ridge Pkwy, Rex, GA 30273 and is currently estimated at $320,464, approximately $159 per square foot. 5882 Rex Ridge Pkwy is a home located in Clayton County with nearby schools including East Clayton Elementary School, Adamson Middle School, and Morrow High School.
Ownership History
Date
Name
Owned For
Owner Type
Purchase Details
Closed on
Nov 12, 2016
Sold by
Melvyn
Bought by
Smith Melvyn and Smith Robyn
Current Estimated Value
Purchase Details
Closed on
Feb 3, 2009
Sold by
Wachovia Bank Na
Bought by
Tim Jones Communities Inc
Home Financials for this Owner
Home Financials are based on the most recent Mortgage that was taken out on this home.
Original Mortgage
$180,250
Interest Rate
5.23%
Mortgage Type
VA
Purchase Details
Closed on
Jan 30, 2009
Sold by
Tim Jones Communities Inc
Bought by
Smith Melvyn
Home Financials for this Owner
Home Financials are based on the most recent Mortgage that was taken out on this home.
Original Mortgage
$180,250
Interest Rate
5.23%
Mortgage Type
VA
Create a Home Valuation Report for This Property
The Home Valuation Report is an in-depth analysis detailing your home's value as well as a comparison with similar homes in the area
Home Values in the Area
Average Home Value in this Area
Purchase History
| Date | Buyer | Sale Price | Title Company |
|---|---|---|---|
| Smith Melvyn | -- | -- | |
| Tim Jones Communities Inc | -- | -- | |
| Smith Melvyn | $180,300 | -- |
Source: Public Records
Mortgage History
| Date | Status | Borrower | Loan Amount |
|---|---|---|---|
| Previous Owner | Smith Melvyn | $180,250 |
Source: Public Records
Tax History Compared to Growth
Tax History
| Year | Tax Paid | Tax Assessment Tax Assessment Total Assessment is a certain percentage of the fair market value that is determined by local assessors to be the total taxable value of land and additions on the property. | Land | Improvement |
|---|---|---|---|---|
| 2024 | $38 | $71,320 | $10,400 | $60,920 |
| 2023 | $2,600 | $72,000 | $10,400 | $61,600 |
| 2022 | $38 | $68,680 | $10,400 | $58,280 |
| 2021 | $38 | $67,400 | $10,400 | $57,000 |
| 2020 | $38 | $65,458 | $10,400 | $55,058 |
| 2019 | $38 | $65,238 | $9,600 | $55,638 |
| 2018 | $38 | $63,888 | $9,600 | $54,288 |
| 2017 | $38 | $55,764 | $9,600 | $46,164 |
| 2016 | $38 | $55,764 | $9,600 | $46,164 |
| 2015 | $38 | $0 | $0 | $0 |
| 2014 | $38 | $37,448 | $9,600 | $27,848 |
Source: Public Records
Map
Nearby Homes
- 3130 Rex Ridge Cir
- 5652 Laney Dr
- 5631 Laney Dr
- 5705 Laney Dr
- 3078 Caliente Ln
- 5838 Highway 42
- 2835 Randy Ct Unit 4
- 3456 Heartland Dr Unit 2
- 6050 Randy Ln
- 3203 Pawnee Dr
- 2820 Rex Rd
- 2811 Appaloosa Run
- 6061 Tina Ln
- 3548 Meadowview Ct
- 5740 Amerson Ln
- 5610 Swanson Rd
- 6082 Kathie Ct
- 6343 Towhee Way
- 6367 Towhee Way
- 5876 Rex Ridge Pkwy
- 5888 Rex Ridge Pkwy
- 5888 Rex Ridge Pkwy Unit LOT 34
- 5973 Rex Ridge Ct
- 5967 Rex Ridge Ct
- 5870 Rex Ridge Pkwy
- 5894 Rex Ridge Pkwy
- 5979 Rex Ridge Ct Unit LOT 15
- 5881 Rex Ridge Pkwy
- 5887 Rex Ridge Pkwy
- 5875 Rex Ridge Pkwy
- 5961 Rex Ridge Ct Unit LOT 12
- 5961 Rex Ridge Ct
- 5864 Rex Ridge Pkwy
- 5893 Rex Ridge Pkwy Unit 86
- 5893 Rex Ridge Pkwy
- 3188 Rex Rd
- 3137 Rex Ridge Crossing
- 5955 Rex Ridge Ct Unit LOT 11
- 5955 Rex Ridge Ct