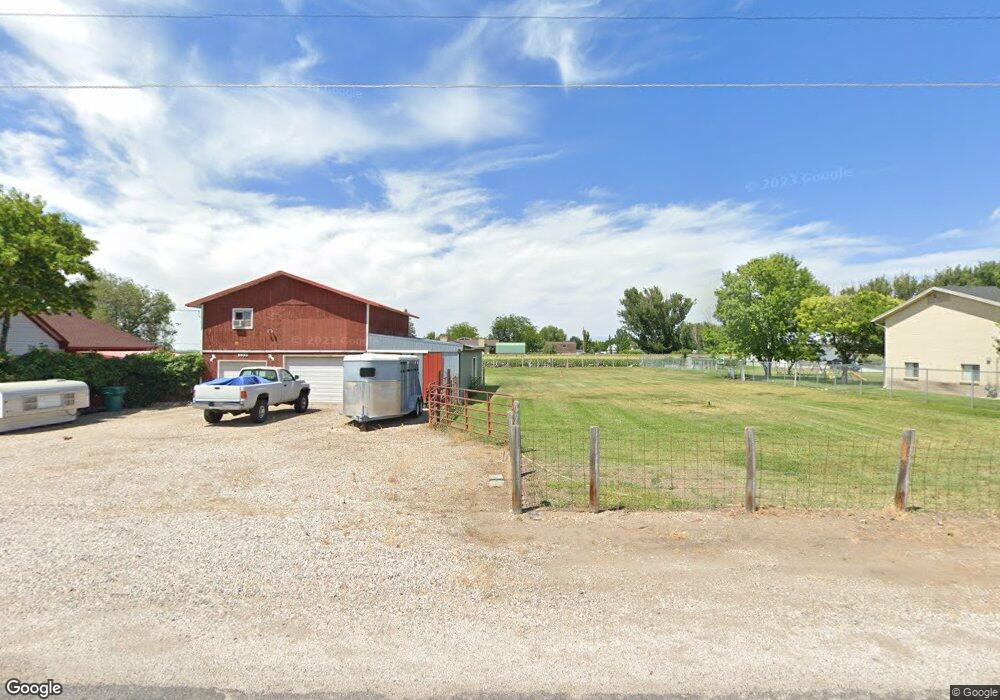
5882 W 4600 S Hooper, UT 84315
Estimated Value: $538,505 - $641,000
4
Beds
3
Baths
2,170
Sq Ft
$268/Sq Ft
Est. Value
About This Home
This home is located at 5882 W 4600 S, Hooper, UT 84315 and is currently estimated at $581,876, approximately $268 per square foot. 5882 W 4600 S is a home located in Weber County with nearby schools including Hooper Elementary School, Rocky Mountain Junior High School, and Fremont High School.
Ownership History
Date
Name
Owned For
Owner Type
Purchase Details
Closed on
May 24, 2019
Sold by
Boyles Kenneth E
Bought by
Elliott Ryen Ceaira and Larkin Derrik
Current Estimated Value
Home Financials for this Owner
Home Financials are based on the most recent Mortgage that was taken out on this home.
Original Mortgage
$318,500
Outstanding Balance
$279,457
Interest Rate
4.1%
Mortgage Type
New Conventional
Estimated Equity
$302,419
Purchase Details
Closed on
Aug 28, 2014
Sold by
Doutre William R
Bought by
Boyles Kenneth E
Home Financials for this Owner
Home Financials are based on the most recent Mortgage that was taken out on this home.
Original Mortgage
$265,481
Interest Rate
4.11%
Mortgage Type
VA
Purchase Details
Closed on
Aug 10, 2009
Sold by
Woodside Wildwood Llc
Bought by
Doutre William R and Doutre Katherine
Home Financials for this Owner
Home Financials are based on the most recent Mortgage that was taken out on this home.
Original Mortgage
$197,500
Interest Rate
5.09%
Mortgage Type
New Conventional
Create a Home Valuation Report for This Property
The Home Valuation Report is an in-depth analysis detailing your home's value as well as a comparison with similar homes in the area
Home Values in the Area
Average Home Value in this Area
Purchase History
| Date | Buyer | Sale Price | Title Company |
|---|---|---|---|
| Elliott Ryen Ceaira | -- | Hickman Land Title Co | |
| Boyles Kenneth E | -- | Old Republic Title | |
| Doutre William R | -- | Us Title Insurance Agency |
Source: Public Records
Mortgage History
| Date | Status | Borrower | Loan Amount |
|---|---|---|---|
| Open | Elliott Ryen Ceaira | $318,500 | |
| Previous Owner | Boyles Kenneth E | $265,481 | |
| Previous Owner | Doutre William R | $197,500 |
Source: Public Records
Tax History Compared to Growth
Tax History
| Year | Tax Paid | Tax Assessment Tax Assessment Total Assessment is a certain percentage of the fair market value that is determined by local assessors to be the total taxable value of land and additions on the property. | Land | Improvement |
|---|---|---|---|---|
| 2025 | $3,180 | $505,102 | $196,356 | $308,746 |
| 2024 | $3,212 | $286,549 | $107,995 | $178,554 |
| 2023 | $3,139 | $277,750 | $107,874 | $169,876 |
| 2022 | $3,199 | $292,050 | $83,095 | $208,955 |
| 2021 | $2,726 | $417,000 | $105,965 | $311,035 |
| 2020 | $2,571 | $361,000 | $100,971 | $260,029 |
| 2019 | $2,505 | $332,000 | $100,654 | $231,346 |
| 2018 | $2,363 | $298,000 | $65,619 | $232,381 |
| 2017 | $2,253 | $274,000 | $65,543 | $208,457 |
| 2016 | $2,065 | $134,596 | $35,936 | $98,660 |
| 2015 | $1,985 | $127,087 | $33,125 | $93,962 |
| 2014 | $1,786 | $110,064 | $27,641 | $82,423 |
Source: Public Records
Map
Nearby Homes
- 5947 W 4600 S
- 3729 S 5600 W Unit 6
- 3720 S 5600 W Unit 2
- 3719 S 5600 W Unit 7
- 6036 W 4700 S
- 4146 S 5800 W Unit 5
- 4163 S 5800 W Unit 2
- 6014 W 5300 S
- 4111 S 5350 W
- 0 W 5500 S
- 3191 S 5100 St W Unit 1
- 4879 S 5050 W
- 3706 S 5650 W Unit 9
- 5478 W 3750 S
- 3691 S 5600 W Unit 20
- 5389 W 3850 S Unit 22
- 5417 W 3850 S
- 5335 W 5500 S
- 3632 S 5400 W
- 4126 S 4950 W
- 5888 W 4600 S
- 5888 W 4600 S
- 5888 W 4600 S
- 5897 W 4600 S
- 4608 S 5900 W
- 5841 W 4600 S
- 5841 W 4600 S
- 5841 W 4600 S Unit 45
- 5841 W 4600 S Unit 29
- 5841 W 4600 S Unit 6
- 5841 W 4600 S Unit 22
- 5858 W 4600 S
- 5840 W 4600 S
- 5916 W 4600 S
- 4605 S 5900 W
- 4615 S 5900 W
- 5819 W 4600 S
- 4557 S 5900 W
- 5822 W 4600 S
- 4691 S 5900 W