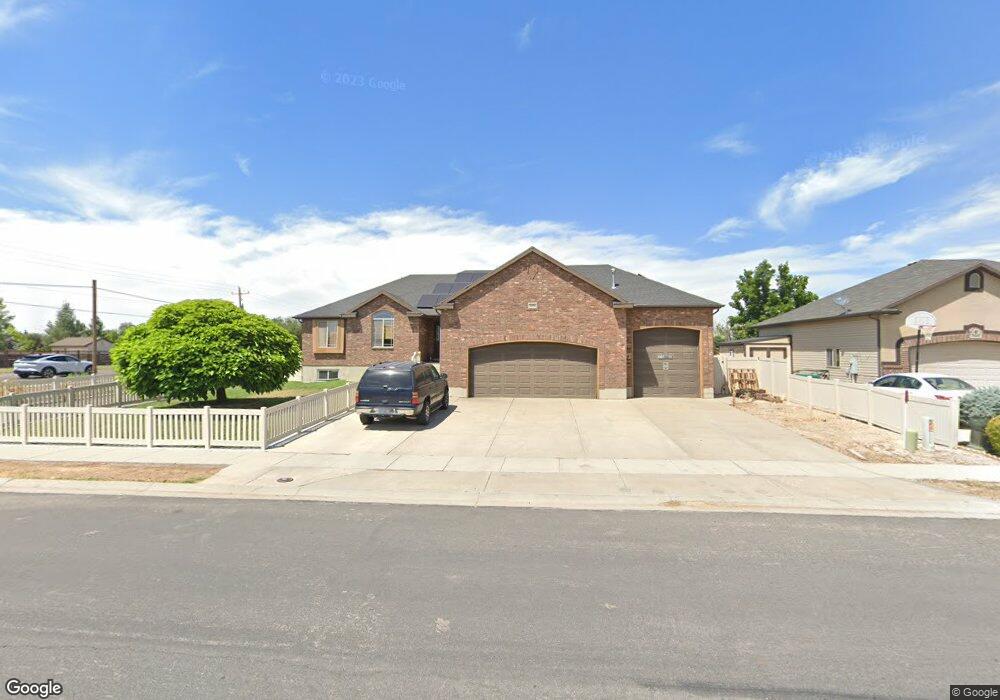
5882 W 5200 S Unit 13 Hooper, UT 84315
Estimated Value: $631,000 - $702,000
5
Beds
4
Baths
1,499
Sq Ft
$445/Sq Ft
Est. Value
About This Home
This home is located at 5882 W 5200 S Unit 13, Hooper, UT 84315 and is currently estimated at $666,340, approximately $444 per square foot. 5882 W 5200 S Unit 13 is a home located in Weber County with nearby schools including Hooper School, Rocky Mountain Junior High School, and Fremont High School.
Ownership History
Date
Name
Owned For
Owner Type
Purchase Details
Closed on
Aug 20, 2008
Sold by
Gabbard Homes Inc
Bought by
Lochner John E and Lochner Veronica
Current Estimated Value
Home Financials for this Owner
Home Financials are based on the most recent Mortgage that was taken out on this home.
Original Mortgage
$318,164
Outstanding Balance
$209,229
Interest Rate
6.37%
Mortgage Type
VA
Estimated Equity
$457,111
Purchase Details
Closed on
Sep 20, 2006
Sold by
Lakeview Farms 1 Llc
Bought by
Gabbard Homes Inc
Home Financials for this Owner
Home Financials are based on the most recent Mortgage that was taken out on this home.
Original Mortgage
$251,250
Interest Rate
6.51%
Mortgage Type
Purchase Money Mortgage
Create a Home Valuation Report for This Property
The Home Valuation Report is an in-depth analysis detailing your home's value as well as a comparison with similar homes in the area
Home Values in the Area
Average Home Value in this Area
Purchase History
| Date | Buyer | Sale Price | Title Company |
|---|---|---|---|
| Lochner John E | -- | Intermountain Title | |
| Gabbard Homes Inc | -- | Mountain View Title |
Source: Public Records
Mortgage History
| Date | Status | Borrower | Loan Amount |
|---|---|---|---|
| Open | Lochner John E | $318,164 | |
| Previous Owner | Gabbard Homes Inc | $251,250 |
Source: Public Records
Tax History Compared to Growth
Tax History
| Year | Tax Paid | Tax Assessment Tax Assessment Total Assessment is a certain percentage of the fair market value that is determined by local assessors to be the total taxable value of land and additions on the property. | Land | Improvement |
|---|---|---|---|---|
| 2025 | $3,610 | $653,382 | $228,255 | $425,127 |
| 2024 | $3,610 | $352,549 | $125,540 | $227,009 |
| 2023 | $3,279 | $317,350 | $125,159 | $192,191 |
| 2022 | $548 | $338,250 | $99,959 | $238,291 |
| 2021 | $64 | $512,000 | $116,774 | $395,226 |
| 2020 | $2,767 | $433,000 | $101,682 | $331,318 |
| 2019 | $2,767 | $400,000 | $91,402 | $308,598 |
| 2018 | $0 | $379,000 | $81,310 | $297,690 |
| 2017 | $2,316 | $310,000 | $81,127 | $228,873 |
| 2016 | $2,054 | $148,425 | $38,650 | $109,775 |
| 2015 | -- | $143,573 | $39,025 | $104,548 |
| 2014 | -- | $130,734 | $39,025 | $91,709 |
Source: Public Records
Map
Nearby Homes
- 5731 W 4100 S
- 5777 W 4100 S
- 6014 W 5300 S
- 0 W 5500 S
- 5947 W 4600 S
- 3729 S 5600 W Unit 6
- 4594 S 6300 W
- 6559 W 4600 S
- 4879 S 5050 W
- 4163 S 5800 W Unit 2
- 4146 S 5800 W Unit 5
- 5160 W 5725 S
- 3191 S 5100 St W Unit 1
- 4909 W 5850 S
- 4931 S 4700 W
- 5752 W 2425 N
- 4700 W 5500 S
- 5319 S 7100 W
- 5071 W 4175 S
- 2276 N 4500 W
- 5882 W 5200 S
- 5866 W 5200 S
- 5834 W 5200 S Unit 15
- 6013 W 5200 S Unit 13
- 5174 S 5900 W
- 5908 W 5200 S
- 5908 W 5200 S Unit 130
- 5183 S 5825 W
- 5881 W 5200 S
- 5881 W 5200 S Unit 26
- 5865 W 5200 S
- 5922 W 5200 S
- 5849 W 5200 S
- 5175 S 5825 W
- 5175 S 5825 W Unit 17
- 5909 W 5200 S Unit 131
- 5932 W 5200 S
- 5923 W 5200 S
- 5278 S 5900 W
- 5278 S 5900 W Unit 27