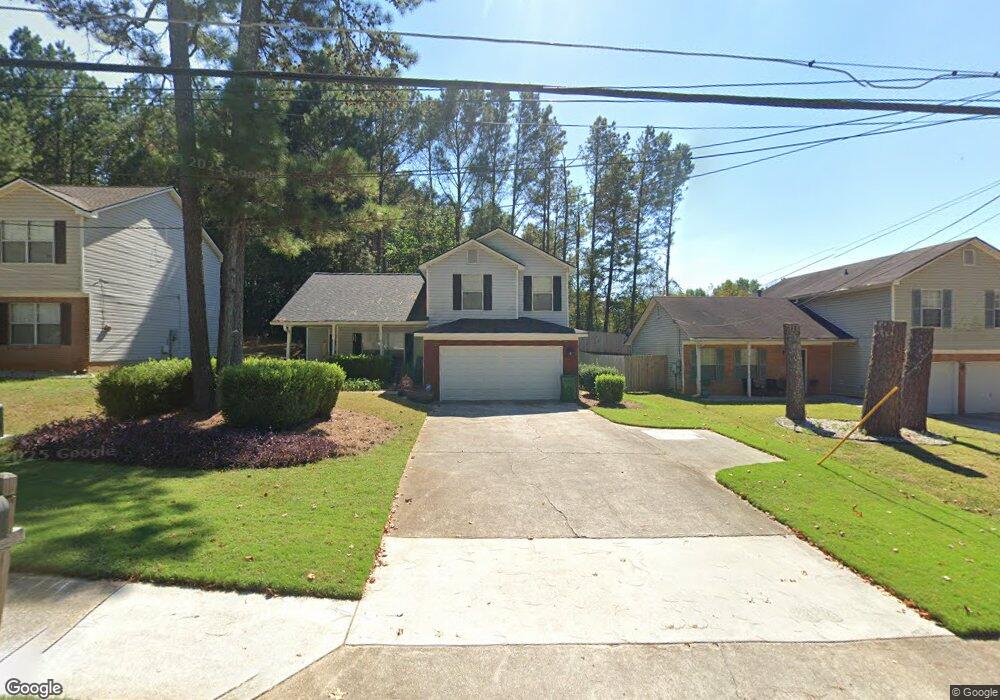
5883 Marbut Rd Lithonia, GA 30058
Estimated Value: $208,334 - $242,000
3
Beds
2
Baths
1,225
Sq Ft
$181/Sq Ft
Est. Value
About This Home
This home is located at 5883 Marbut Rd, Lithonia, GA 30058 and is currently estimated at $222,084, approximately $181 per square foot. 5883 Marbut Rd is a home located in DeKalb County with nearby schools including Panola Way Elementary School, Miller Grove Middle School, and Miller Grove High School.
Ownership History
Date
Name
Owned For
Owner Type
Purchase Details
Closed on
Dec 18, 2007
Sold by
Cwabs Inc Series 2005-13
Bought by
Jones Cheryl R and Johnson Derrick
Current Estimated Value
Home Financials for this Owner
Home Financials are based on the most recent Mortgage that was taken out on this home.
Original Mortgage
$105,050
Outstanding Balance
$65,975
Interest Rate
6.15%
Mortgage Type
FHA
Estimated Equity
$156,109
Purchase Details
Closed on
Sep 4, 2007
Sold by
Fields Rhashida T
Bought by
Bank Of New York 2005-13
Purchase Details
Closed on
Dec 12, 2000
Sold by
Snug Homes Inc
Bought by
Fields Rhashida T
Home Financials for this Owner
Home Financials are based on the most recent Mortgage that was taken out on this home.
Original Mortgage
$120,950
Interest Rate
7.79%
Mortgage Type
FHA
Create a Home Valuation Report for This Property
The Home Valuation Report is an in-depth analysis detailing your home's value as well as a comparison with similar homes in the area
Home Values in the Area
Average Home Value in this Area
Purchase History
| Date | Buyer | Sale Price | Title Company |
|---|---|---|---|
| Jones Cheryl R | $106,800 | -- | |
| Bank Of New York 2005-13 | $107,680 | -- | |
| Fields Rhashida T | $121,100 | -- |
Source: Public Records
Mortgage History
| Date | Status | Borrower | Loan Amount |
|---|---|---|---|
| Open | Jones Cheryl R | $105,050 | |
| Previous Owner | Fields Rhashida T | $120,950 |
Source: Public Records
Tax History Compared to Growth
Tax History
| Year | Tax Paid | Tax Assessment Tax Assessment Total Assessment is a certain percentage of the fair market value that is determined by local assessors to be the total taxable value of land and additions on the property. | Land | Improvement |
|---|---|---|---|---|
| 2025 | $2,451 | $86,040 | $15,200 | $70,840 |
| 2024 | $2,691 | $94,000 | $15,200 | $78,800 |
| 2023 | $2,691 | $96,240 | $15,200 | $81,040 |
| 2022 | $3,347 | $69,120 | $4,440 | $64,680 |
| 2021 | $1,655 | $52,280 | $4,440 | $47,840 |
| 2020 | $1,567 | $48,280 | $4,440 | $43,840 |
| 2019 | $1,512 | $46,680 | $4,440 | $42,240 |
| 2018 | $1,250 | $42,040 | $4,440 | $37,600 |
| 2017 | $1,230 | $37,280 | $4,440 | $32,840 |
| 2016 | $945 | $29,880 | $4,440 | $25,440 |
| 2014 | $780 | $24,960 | $4,440 | $20,520 |
Source: Public Records
Map
Nearby Homes
- 2089 Quilt Ct
- 2063 Wellborn Close
- 2158 Sara Ashley Way
- 5805 Marbut Rd
- 2138 Tiffany Trail
- 5822 Cedar Croft Ln
- 2202 Lowtrail Ct
- 2030 Hilda Burns Place
- 2218 Lowtrail Ct
- 2169 Tiffany Ln
- 2128 Tiffany Ln
- 5876 Old Wellborn Trace
- 6047 Marbut Rd
- 5813 Wellborn Oaks Ct
- 5812 Wind Gate Ln
- 2067 Raintree Place
- 2045 Lown Farm Trail Unit 3
- 2237 Wind Rose Ct
- 5734 Wellborn Oaks Ct
- 2284 Cypress Point Way
- 5877 Marbut Rd
- 5891 Marbut Rd Unit 28
- 5891 Marbut Rd
- 5873 Marbut Rd Unit 5
- 5867 Marbut Rd Unit 5
- 2248 Clayton Ridge
- 5874 Marbut Rd
- 5882 Marbut Rd
- 2252 Clayton Ridge
- 5863 Marbut Rd
- 5890 Marbut Rd
- 5890 Marbut Rd Unit 5890
- 5866 Marbut Rd Unit 5866
- 5866 Marbut Rd
- 2251 Clayton Ridge Unit 5
- 2244 Clayton Ridge
- 5859 Marbut Rd
- 5910 Sara Ashley Ct
- 2125 Jessica Way
- 5918 Sara Ashley Ct