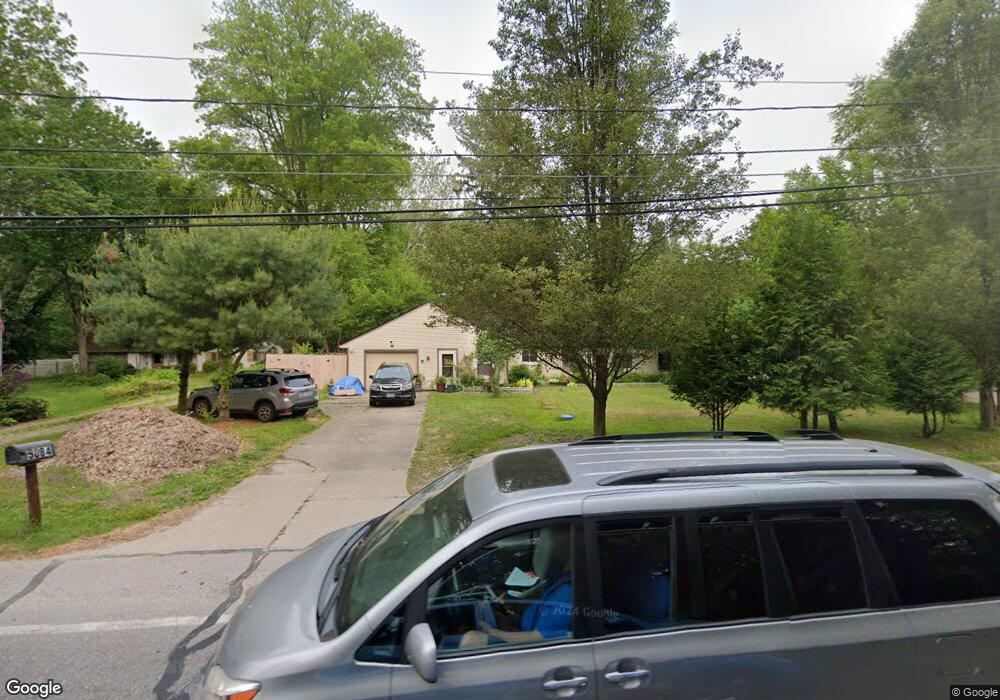
5884 Lewis Rd Olmsted Falls, OH 44138
Estimated Value: $242,000 - $313,000
3
Beds
2
Baths
1,961
Sq Ft
$140/Sq Ft
Est. Value
About This Home
This home is located at 5884 Lewis Rd, Olmsted Falls, OH 44138 and is currently estimated at $274,164, approximately $139 per square foot. 5884 Lewis Rd is a home located in Cuyahoga County with nearby schools including Falls-Lenox Primary Elementary School, Olmsted Falls Intermediate Building, and Olmsted Falls Middle School.
Ownership History
Date
Name
Owned For
Owner Type
Purchase Details
Closed on
Sep 13, 2005
Sold by
Boger Barbara J
Bought by
Weiland Tiffany
Current Estimated Value
Home Financials for this Owner
Home Financials are based on the most recent Mortgage that was taken out on this home.
Original Mortgage
$128,500
Outstanding Balance
$69,093
Interest Rate
5.93%
Mortgage Type
Fannie Mae Freddie Mac
Estimated Equity
$205,071
Purchase Details
Closed on
Sep 9, 1983
Sold by
Boger Charles Robert
Bought by
Boger Charles R
Purchase Details
Closed on
Aug 28, 1980
Sold by
Martinez John L and Martinez Barbara A
Bought by
Boger Charles Robert
Purchase Details
Closed on
Jan 1, 1975
Bought by
Martinez John L and Martinez Barbara A
Create a Home Valuation Report for This Property
The Home Valuation Report is an in-depth analysis detailing your home's value as well as a comparison with similar homes in the area
Home Values in the Area
Average Home Value in this Area
Purchase History
| Date | Buyer | Sale Price | Title Company |
|---|---|---|---|
| Weiland Tiffany | $128,500 | Guardian Title & Guaranty | |
| Boger Charles R | -- | -- | |
| Boger Charles Robert | $35,000 | -- | |
| Martinez John L | -- | -- |
Source: Public Records
Mortgage History
| Date | Status | Borrower | Loan Amount |
|---|---|---|---|
| Open | Weiland Tiffany | $128,500 |
Source: Public Records
Tax History Compared to Growth
Tax History
| Year | Tax Paid | Tax Assessment Tax Assessment Total Assessment is a certain percentage of the fair market value that is determined by local assessors to be the total taxable value of land and additions on the property. | Land | Improvement |
|---|---|---|---|---|
| 2024 | $5,520 | $75,250 | $5,040 | $70,210 |
| 2023 | $5,167 | $57,970 | $4,100 | $53,870 |
| 2022 | $5,177 | $57,960 | $4,095 | $53,865 |
| 2021 | $5,127 | $57,960 | $4,100 | $53,870 |
| 2020 | $4,859 | $48,690 | $3,430 | $45,260 |
| 2019 | $4,393 | $139,100 | $9,800 | $129,300 |
| 2018 | $4,193 | $48,690 | $3,430 | $45,260 |
| 2017 | $3,889 | $41,580 | $3,150 | $38,430 |
| 2016 | $3,869 | $41,580 | $3,150 | $38,430 |
| 2015 | $3,946 | $41,580 | $3,150 | $38,430 |
| 2014 | $3,946 | $41,580 | $3,150 | $38,430 |
Source: Public Records
Map
Nearby Homes
- 5668 Allendale Dr
- 25118 Carey Ln
- 5308 Columbia Rd
- 24300 Mastick Rd
- 24326 Mastick Rd
- 0 Mastick Rd Unit 5112571
- 0 V L Clareshire Dr
- 31 Vista Cir Unit A
- 8 Golf View Ln
- 385 Vista Cir
- 274 Vista Cir Unit B
- 4849 Grace Rd Unit 121
- 0 River Rd Unit 5169658
- 7030 Columbia Rd
- 25305 Country Club Blvd Unit 10
- 25735 Lorain Rd Unit 218
- 55 Patio Ln
- 23052 Mastick Rd
- 11 Brookins Dr
- 4666 Brendan Cir
- 25000 Rainbow Dr
- 24000 Rainbow Dr
- 5883 Lewis Rd
- 25005 Rainbow Dr
- 25004 Rainbow Dr
- 0 Lewis Rd Unit 3803449
- 0 Lewis Rd Unit 660516
- 0 Lewis Rd Unit 4355272
- 25008 Rainbow Dr
- 25015 Rainbow Dr
- 25012 Rainbow Dr
- 5876 Lewis Rd
- 25016 Rainbow Dr
- 25017 Rainbow Dr
- 25019 Rainbow Dr
- 25020 Rainbow Dr
- 25020 Rainbow Dr
- 25025 Rainbow Dr
- 25024 Rainbow Dr
- 6086 Lewis Rd