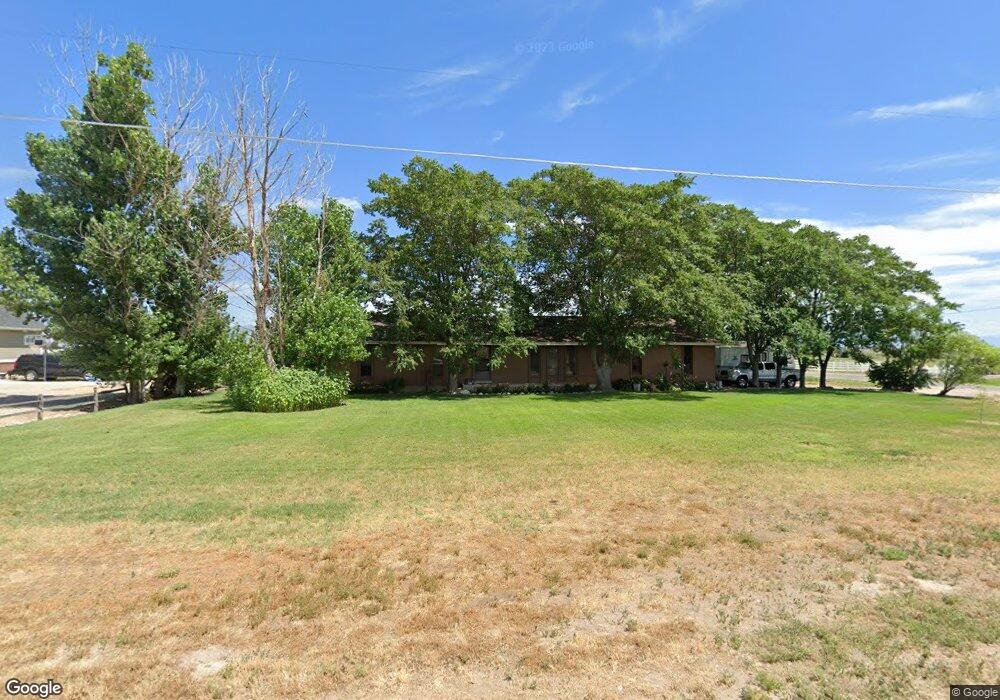
5884 S 7100 W Hooper, UT 84315
Estimated Value: $569,000 - $623,000
3
Beds
2
Baths
1,850
Sq Ft
$325/Sq Ft
Est. Value
About This Home
This home is located at 5884 S 7100 W, Hooper, UT 84315 and is currently estimated at $601,360, approximately $325 per square foot. 5884 S 7100 W is a home located in Weber County with nearby schools including Hooper School, Rocky Mountain Junior High School, and Fremont High School.
Ownership History
Date
Name
Owned For
Owner Type
Purchase Details
Closed on
Sep 21, 2017
Sold by
Botts Ii Richard T
Bought by
Botts Ii Richard T and Gilbert Susan G
Current Estimated Value
Purchase Details
Closed on
Jan 31, 2000
Sold by
Fowers Bart L and Fowers Sharon K
Bought by
Botts Ii Richard T
Home Financials for this Owner
Home Financials are based on the most recent Mortgage that was taken out on this home.
Original Mortgage
$112,400
Outstanding Balance
$36,613
Interest Rate
7.96%
Estimated Equity
$564,747
Purchase Details
Closed on
Mar 16, 1999
Sold by
Fowers Bart L and Fowers Sharon Kay
Bought by
Fowers Bart L and Fowers Sharon K
Home Financials for this Owner
Home Financials are based on the most recent Mortgage that was taken out on this home.
Original Mortgage
$100,750
Interest Rate
6.73%
Create a Home Valuation Report for This Property
The Home Valuation Report is an in-depth analysis detailing your home's value as well as a comparison with similar homes in the area
Home Values in the Area
Average Home Value in this Area
Purchase History
| Date | Buyer | Sale Price | Title Company |
|---|---|---|---|
| Botts Ii Richard T | -- | None Available | |
| Botts Ii Richard T | -- | -- | |
| Fowers Bart L | -- | Mountain View Title |
Source: Public Records
Mortgage History
| Date | Status | Borrower | Loan Amount |
|---|---|---|---|
| Open | Botts Ii Richard T | $112,400 | |
| Previous Owner | Fowers Bart L | $100,750 |
Source: Public Records
Tax History Compared to Growth
Tax History
| Year | Tax Paid | Tax Assessment Tax Assessment Total Assessment is a certain percentage of the fair market value that is determined by local assessors to be the total taxable value of land and additions on the property. | Land | Improvement |
|---|---|---|---|---|
| 2025 | $2,816 | $492,090 | $179,965 | $312,125 |
| 2024 | $2,785 | $287,441 | $98,980 | $188,461 |
| 2023 | $2,523 | $257,200 | $99,002 | $158,198 |
| 2022 | $2,672 | $260,699 | $76,998 | $183,701 |
| 2021 | $2,390 | $385,000 | $105,000 | $280,000 |
| 2020 | $2,349 | $345,000 | $90,008 | $254,992 |
| 2019 | $2,209 | $311,000 | $90,000 | $221,000 |
| 2018 | $2,119 | $285,000 | $90,000 | $195,000 |
| 2017 | $1,983 | $260,000 | $90,000 | $170,000 |
| 2016 | $1,806 | $138,067 | $49,500 | $88,567 |
| 2015 | $1,517 | $114,600 | $30,250 | $84,350 |
| 2014 | $1,417 | $104,241 | $30,250 | $73,991 |
Source: Public Records
Map
Nearby Homes
- 5852 S 7100 W
- 5885 S 7100 W
- 5861 S 7100 W
- 7059 W 5900 S
- 7059 W 5900 S Unit 2
- 7083 W 5900 S
- 7040 W 5900 S
- 5927 S 7100 W
- 5831 S 7100 W
- 7035 W 5900 S
- 7035 W 5900 S Unit 3
- 5930 S 7100 W
- 7007 W 5900 S
- 7007 W 5900 S Unit 4
- 5962 S 7100 W
- 5727 S 7100 W
- 5717 S 7100 W
- 6955 W 5900 S
- 6049 S 7100 W
- 6006 S 7100 W