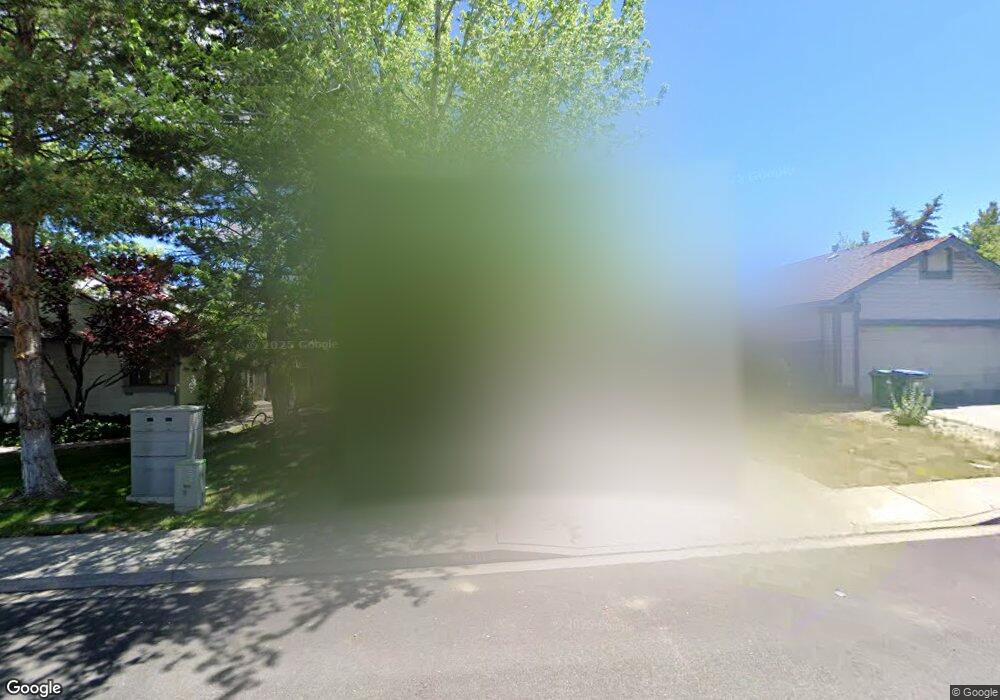
5886 Coyote Ridge Rd Reno, NV 89523
Mae Anne Avenue NeighborhoodEstimated Value: $482,000 - $506,836
3
Beds
2
Baths
1,324
Sq Ft
$376/Sq Ft
Est. Value
About This Home
This home is located at 5886 Coyote Ridge Rd, Reno, NV 89523 and is currently estimated at $497,959, approximately $376 per square foot. 5886 Coyote Ridge Rd is a home located in Washoe County with nearby schools including Sarah Winnemucca Elementary School, B D Billinghurst Middle School, and Robert McQueen High School.
Ownership History
Date
Name
Owned For
Owner Type
Purchase Details
Closed on
Mar 5, 2009
Sold by
Brown Douglas R and Brown Leslie R
Bought by
Brown Douglas Robert and Brown Leslie Renee
Current Estimated Value
Purchase Details
Closed on
Apr 24, 2003
Sold by
Wagner Paul E and Wagner Nancy M
Bought by
Brown Douglas R and Brown Leslie R
Home Financials for this Owner
Home Financials are based on the most recent Mortgage that was taken out on this home.
Original Mortgage
$198,390
Outstanding Balance
$84,977
Interest Rate
5.71%
Mortgage Type
VA
Estimated Equity
$412,982
Purchase Details
Closed on
Aug 27, 1998
Sold by
Covington Mark H and Covington Jody
Bought by
Wagner Paul E and Wagner Nancy M
Home Financials for this Owner
Home Financials are based on the most recent Mortgage that was taken out on this home.
Original Mortgage
$138,599
Interest Rate
6.91%
Mortgage Type
FHA
Create a Home Valuation Report for This Property
The Home Valuation Report is an in-depth analysis detailing your home's value as well as a comparison with similar homes in the area
Home Values in the Area
Average Home Value in this Area
Purchase History
| Date | Buyer | Sale Price | Title Company |
|---|---|---|---|
| Brown Douglas Robert | -- | None Available | |
| Brown Douglas R | $194,500 | First American Title | |
| Wagner Paul E | $141,000 | First Centennial Title Co |
Source: Public Records
Mortgage History
| Date | Status | Borrower | Loan Amount |
|---|---|---|---|
| Open | Brown Douglas R | $198,390 | |
| Previous Owner | Wagner Paul E | $138,599 |
Source: Public Records
Tax History Compared to Growth
Tax History
| Year | Tax Paid | Tax Assessment Tax Assessment Total Assessment is a certain percentage of the fair market value that is determined by local assessors to be the total taxable value of land and additions on the property. | Land | Improvement |
|---|---|---|---|---|
| 2025 | $3,373 | $73,442 | $35,406 | $38,036 |
| 2024 | $3,373 | $70,776 | $32,036 | $38,740 |
| 2023 | $4,553 | $70,859 | $33,768 | $37,091 |
| 2022 | $1,739 | $59,132 | $28,445 | $30,687 |
| 2021 | $2,513 | $50,396 | $19,562 | $30,834 |
| 2020 | $2,680 | $49,984 | $18,806 | $31,178 |
| 2019 | $2,520 | $49,076 | $18,680 | $30,396 |
| 2018 | $2,517 | $43,553 | $13,577 | $29,976 |
| 2017 | $2,445 | $42,915 | $12,663 | $30,252 |
| 2016 | $2,392 | $42,548 | $11,403 | $31,145 |
| 2015 | $1,460 | $41,304 | $9,986 | $31,318 |
| 2014 | $2,292 | $39,766 | $8,978 | $30,788 |
| 2013 | -- | $37,404 | $6,883 | $30,521 |
Source: Public Records
Map
Nearby Homes
- 1626 Icelandic Way
- 1639 Prancer St Unit Lot 47
- 1618 Icelandic Way Unit Lot 67
- 1618 Icelandic Way
- Walker Plan at Monarch
- Humboldt Plan at Monarch
- 5849 Morgan Horse St
- 1615 Prancer St Unit Lot 53
- 1627 Prancer St Unit Lot 50
- 1627 Prancer St
- 5882 Grand Row Way Unit Lot 61
- 1770 Amarak Way
- 5878 Grand Row Way
- 1689 Shadow Park Dr
- 1659 Shadow Park Dr
- 5721 Royal Vista Way
- 1708 Kristin Way
- 5895 Blue Horizon Dr
- 5870 Blue Horizon Dr
- 5830 Blue Horizon Dr
- 5880 Coyote Ridge Rd
- 5890 Coyote Ridge Rd
- 5876 Coyote Ridge Rd
- 1772 Grand Point Way
- 5870 Coyote Ridge Rd Unit 4
- 1773 Melbourne Ct
- 000 Grandpoint
- 000 Grandpoint
- 5906 Coyote Ridge Rd
- 1173 Melbourne Ct
- 1782 Grand Point Way
- 5866 Coyote Ridge Rd
- 1777 Melbourne Ct
- 1792 Grand Point Way
- 5869 Morgan Horse St Unit Lot 14
- 5860 Coyote Ridge Rd
- 1771 Grand Point Way
- 1781 Grand Point Way
- 1802 Grand Point Way
- 5926 Coyote Ridge Rd