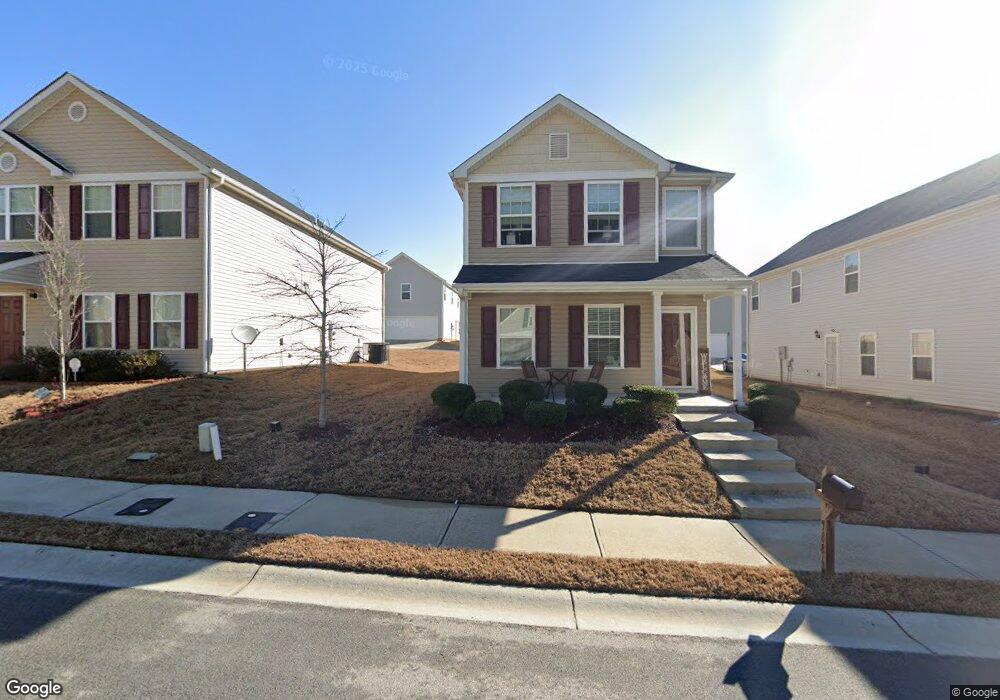
5886 Westchase St Unit 50 Atlanta, GA 30336
Estimated Value: $277,000 - $287,000
3
Beds
3
Baths
1,608
Sq Ft
$175/Sq Ft
Est. Value
About This Home
This home is located at 5886 Westchase St Unit 50, Atlanta, GA 30336 and is currently estimated at $280,722, approximately $174 per square foot. 5886 Westchase St Unit 50 is a home located in Fulton County with nearby schools including Stonewall Tell Elementary School, Sandtown Middle School, and Westlake High School.
Ownership History
Date
Name
Owned For
Owner Type
Purchase Details
Closed on
Apr 28, 2021
Sold by
Thomas Melba
Bought by
Rapp Shawana
Current Estimated Value
Home Financials for this Owner
Home Financials are based on the most recent Mortgage that was taken out on this home.
Original Mortgage
$192,449
Outstanding Balance
$174,407
Interest Rate
3.1%
Mortgage Type
FHA
Estimated Equity
$106,315
Purchase Details
Closed on
Apr 27, 2018
Sold by
Wjh Llc
Bought by
Thomas Melba
Home Financials for this Owner
Home Financials are based on the most recent Mortgage that was taken out on this home.
Original Mortgage
$144,035
Interest Rate
4.44%
Mortgage Type
New Conventional
Purchase Details
Closed on
Jul 8, 2014
Sold by
Sci Partners I Llc
Bought by
Geosam Capital Us Atlanta Lp
Purchase Details
Closed on
Jun 3, 2008
Sold by
Greenwood Homes Inc
Bought by
Suntrust Bk
Create a Home Valuation Report for This Property
The Home Valuation Report is an in-depth analysis detailing your home's value as well as a comparison with similar homes in the area
Home Values in the Area
Average Home Value in this Area
Purchase History
| Date | Buyer | Sale Price | Title Company |
|---|---|---|---|
| Rapp Shawana | $200,000 | -- | |
| Thomas Melba | $148,490 | -- | |
| Geosam Capital Us Atlanta Lp | $1,500 | -- | |
| Suntrust Bk | $30,000 | -- | |
| Suntrust Bank | $30,000 | -- |
Source: Public Records
Mortgage History
| Date | Status | Borrower | Loan Amount |
|---|---|---|---|
| Open | Rapp Shawana | $192,449 | |
| Previous Owner | Thomas Melba | $144,035 |
Source: Public Records
Tax History Compared to Growth
Tax History
| Year | Tax Paid | Tax Assessment Tax Assessment Total Assessment is a certain percentage of the fair market value that is determined by local assessors to be the total taxable value of land and additions on the property. | Land | Improvement |
|---|---|---|---|---|
| 2025 | $4,604 | $128,880 | $23,560 | $105,320 |
| 2023 | $3,239 | $114,760 | $22,760 | $92,000 |
| 2022 | $2,832 | $72,240 | $15,840 | $56,400 |
| 2021 | $1,478 | $64,000 | $14,040 | $49,960 |
| 2020 | $1,337 | $50,440 | $12,160 | $38,280 |
| 2019 | $1,390 | $52,400 | $10,920 | $41,480 |
| 2018 | $425 | $10,680 | $10,680 | $0 |
| 2017 | $33 | $800 | $800 | $0 |
| 2016 | $28 | $800 | $800 | $0 |
| 2015 | $101 | $800 | $800 | $0 |
| 2014 | $107 | $2,480 | $2,480 | $0 |
Source: Public Records
Map
Nearby Homes
- 147 Karim Terrace
- 5987 Westchase St
- 5675 Cascade Run SW
- 5667 Cascade Run SW
- 6070 Bakers Ferry Rd SW
- 5600 Cascade Run SW
- 5667 Cascade Pass SW
- 5512 Cascade Run SW
- 5481 Cascade Ridge SW
- 0 Boat Rock Rd SW Unit LotWP001 24286540
- 0 Boat Rock Rd SW Unit 10572916
- 0 Boat Rock Rd SW Unit 7472456
- 5617 Casablanca Ln
- 285 Cascade Rise Ct SW
- 380 Cascade Rise Ct SW
- 9089 Hanover St
- 9091 Hanover St
- 9093 Hanover St
- 355 Wilma Ct SW Unit 2
- 5886 Westchase St
- 5890 Westchase St
- 5890 Westchase St Unit 49
- 5882 Westchase St Unit 51
- 5882 Westchase St
- 5883 Westchase St Unit 23
- 5883 Westchase St
- 5887 Westchase St Unit 24
- 5887 Westchase St
- 5998 Westchase St
- 5998 Westchase St Unit 48
- 5870 Westchase St Unit 52
- 5870 Westchase St
- 5898 Westchase St
- 1123 Westchase View
- 1123 Westchase View Unit 54
- 1135 Westchase View
- 1135 Westchase View Unit 57
- 1127 Westchase View
- 1127 Westchase View Unit 55