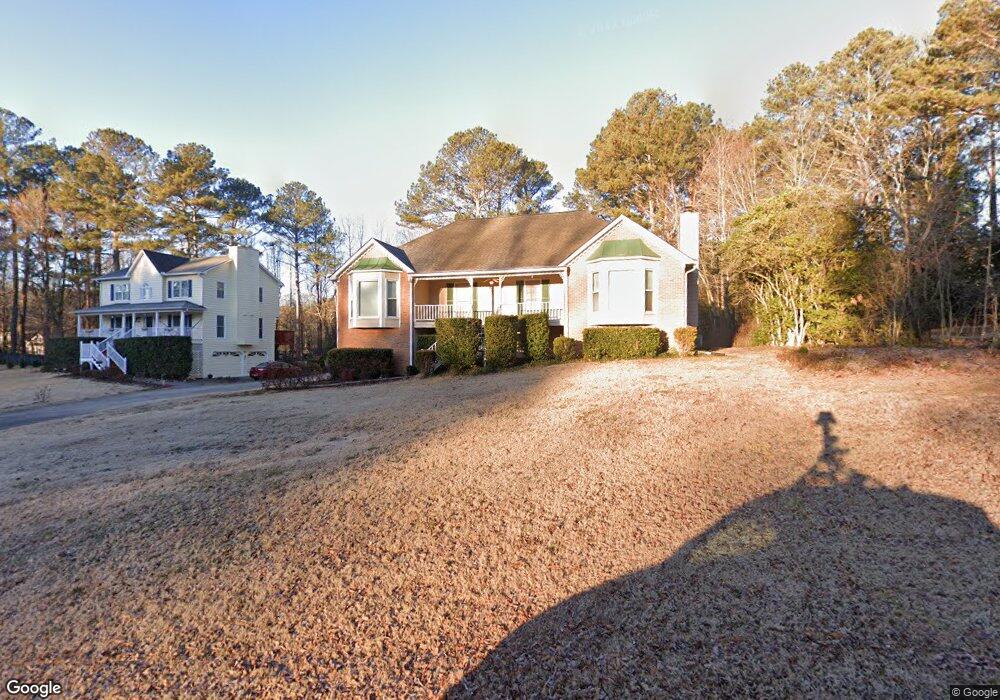
5889 Pavillion Dr Powder Springs, GA 30127
West Cobb NeighborhoodEstimated Value: $347,225 - $410,000
3
Beds
2
Baths
1,678
Sq Ft
$223/Sq Ft
Est. Value
About This Home
This home is located at 5889 Pavillion Dr, Powder Springs, GA 30127 and is currently estimated at $373,556, approximately $222 per square foot. 5889 Pavillion Dr is a home located in Cobb County with nearby schools including Vaughan Elementary School, Lost Mountain Middle School, and Harrison High School.
Ownership History
Date
Name
Owned For
Owner Type
Purchase Details
Closed on
Oct 2, 2001
Sold by
Gough James R
Bought by
Foran Karla J and Foran Joseph M
Current Estimated Value
Home Financials for this Owner
Home Financials are based on the most recent Mortgage that was taken out on this home.
Original Mortgage
$118,720
Outstanding Balance
$45,957
Interest Rate
6.89%
Mortgage Type
New Conventional
Estimated Equity
$327,599
Purchase Details
Closed on
Nov 21, 1995
Sold by
Frizzell Edwin E Nancy
Bought by
Gough James R
Purchase Details
Closed on
Apr 29, 1994
Sold by
Jones Otto E Mary Lou
Bought by
Frizzell Edwin E Nancy
Home Financials for this Owner
Home Financials are based on the most recent Mortgage that was taken out on this home.
Original Mortgage
$110,736
Interest Rate
8.07%
Mortgage Type
FHA
Purchase Details
Closed on
Nov 11, 1993
Sold by
Gilner Aleck W
Bought by
Jones Otto E Mary L
Home Financials for this Owner
Home Financials are based on the most recent Mortgage that was taken out on this home.
Original Mortgage
$89,250
Interest Rate
6.95%
Create a Home Valuation Report for This Property
The Home Valuation Report is an in-depth analysis detailing your home's value as well as a comparison with similar homes in the area
Home Values in the Area
Average Home Value in this Area
Purchase History
| Date | Buyer | Sale Price | Title Company |
|---|---|---|---|
| Foran Karla J | $148,400 | -- | |
| Gough James R | $114,000 | -- | |
| Frizzell Edwin E Nancy | $113,300 | -- | |
| Jones Otto E Mary L | $105,000 | -- |
Source: Public Records
Mortgage History
| Date | Status | Borrower | Loan Amount |
|---|---|---|---|
| Open | Foran Karla J | $118,720 | |
| Previous Owner | Frizzell Edwin E Nancy | $110,736 | |
| Previous Owner | Jones Otto E Mary L | $89,250 | |
| Closed | Gough James R | $0 |
Source: Public Records
Tax History Compared to Growth
Tax History
| Year | Tax Paid | Tax Assessment Tax Assessment Total Assessment is a certain percentage of the fair market value that is determined by local assessors to be the total taxable value of land and additions on the property. | Land | Improvement |
|---|---|---|---|---|
| 2025 | $2,678 | $117,064 | $34,000 | $83,064 |
| 2024 | $2,680 | $117,064 | $34,000 | $83,064 |
| 2023 | $1,585 | $91,592 | $16,000 | $75,592 |
| 2022 | $2,144 | $91,592 | $16,000 | $75,592 |
| 2021 | $2,144 | $91,592 | $16,000 | $75,592 |
| 2020 | $1,880 | $79,524 | $16,000 | $63,524 |
| 2019 | $1,700 | $71,308 | $14,000 | $57,308 |
| 2018 | $1,700 | $71,308 | $14,000 | $57,308 |
| 2017 | $1,433 | $61,868 | $14,000 | $47,868 |
| 2016 | $1,392 | $59,868 | $12,000 | $47,868 |
| 2015 | $1,302 | $54,416 | $14,400 | $40,016 |
| 2014 | $1,313 | $54,416 | $0 | $0 |
Source: Public Records
Map
Nearby Homes
- 5900 Pavillion Dr
- 5585 Lavender Farms Rd
- 582 Braidwood Dr NW
- 6049 Braidwood Close NW Unit 5
- 409 Santa Ana Ct
- 403 Wild Iris Ln Unit 6
- 5954 Henley Dr
- 6049 Wyndham Woods Dr
- 718 1st Cotton Dr
- 6100 Braidwood Ct NW
- 691 Braidwood Terrace NW
- 632 Owl Creek Dr
- 128 Courtland Cir
- 5904 Clairmont Way
- 154 Gold Leaf Trail
- 219 Wyndhamwood Trail
- 870 Fairwood Pointe NW
- 5891 Pavillion Dr
- 5878 Yardley Ct
- 5893 Pavillion Dr
- 0 Pavillion Dr Unit 8142034
- 5888 Pavillion Dr
- 5890 Pavillion Dr
- 5895 Pavillion Dr
- 5887 Pavillion Dr
- 5879 Yardley Ct
- 5892 Pavillion Dr
- 5897 Pavillion Dr
- 5885 Pavillion Dr
- 0 Trellis Ct Unit 8539011
- 0 Trellis Ct Unit 8018566
- 0 Trellis Ct Unit 7173671
- 0 Trellis Ct Unit 3194733
- 0 Trellis Ct Unit 7102773
- 0 Trellis Ct
- 5886 Pavillion Dr
- 404 Antioch Rd