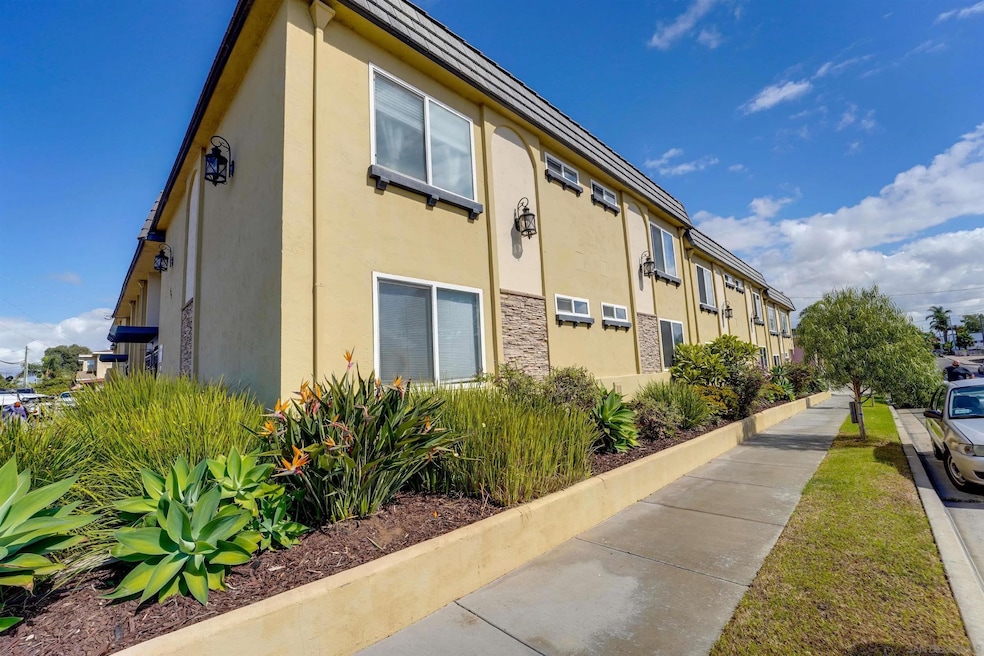
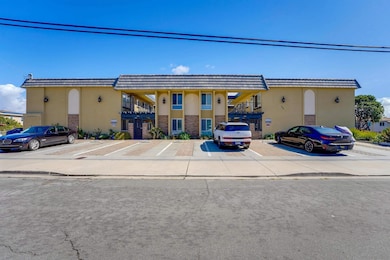
589 11th St Unit 9 Imperial Beach, CA 91932
Estimated payment $2,565/month
Highlights
- 20,923 Sq Ft lot
- Living Room
- Forced Air Heating System
- Community Pool
- 1-Story Property
- 1-minute walk to Teeple Park
About This Home
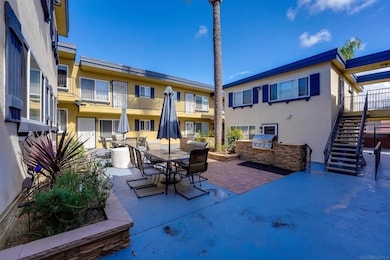
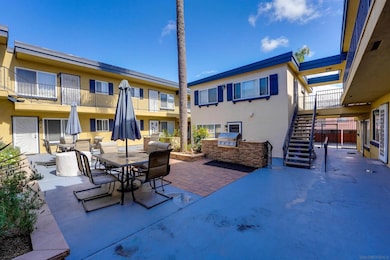
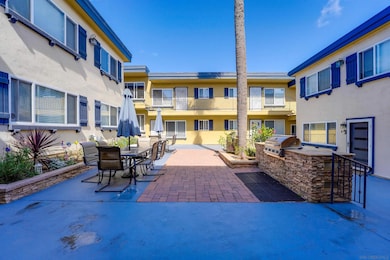
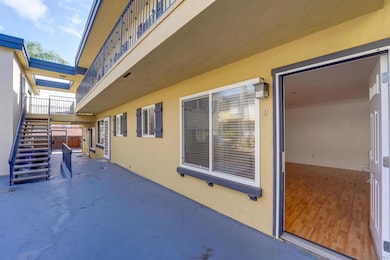
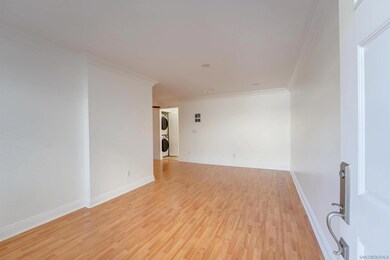
Welcome to coastal living at its best! This beautifully updated 1-bedroom, 1-bath condo is located just minutes from the beach in the heart of Imperial Beach. Situated in a gated community, Unit #9 at 589 11th Street offers a bright and open floor plan with approximately 610 sq ft of comfortable living space. Enjoy a stylish interior featuring wood-style flooring, granite countertops, stainless steel appliances, and custom Bali blinds. The kitchen opens seamlessly to the living area — perfect for entertaining or relaxing after a day by the ocean. A stacked washer and dryer are conveniently located inside the unit, and the home includes one assigned parking space. Community amenities include secure entry, well-maintained common areas, and outdoor gas grills for weekend gatherings. Low HOA dues cover exterior maintenance, water, and trash, making this a perfect choice for first-time buyers, investors, or those looking for a low-maintenance beach getaway. Enjoy the best of Imperial Beach living — just minutes to the sand, Silver Strand bike path, local shops, dining, and entertainment. Easy access to Coronado and Downtown San Diego make this an ideal coastal retreat!
Property Details
Home Type
- Condominium
Year Built
- Built in 1972
HOA Fees
- $255 Monthly HOA Fees
Parking
- 1 Parking Space
Interior Spaces
- 1 Bedroom
- 610 Sq Ft Home
- 1-Story Property
- Living Room
- Disposal
Utilities
- Forced Air Heating System
Community Details
Overview
- Association fees include common area maintenance
- Sand Pointe HOA
- Imperial Beach Subdivision
Recreation
- Community Pool
Map
Home Values in the Area
Average Home Value in this Area
Tax History
| Year | Tax Paid | Tax Assessment Tax Assessment Total Assessment is a certain percentage of the fair market value that is determined by local assessors to be the total taxable value of land and additions on the property. | Land | Improvement |
|---|---|---|---|---|
| 2025 | $4,738 | $375,000 | $224,000 | $151,000 |
| 2024 | $4,738 | $386,000 | $231,000 | $155,000 |
| 2023 | $4,491 | $355,000 | $213,000 | $142,000 |
| 2022 | $2,874 | $218,726 | $131,236 | $87,490 |
| 2021 | $2,887 | $214,438 | $128,663 | $85,775 |
| 2020 | $2,767 | $212,240 | $127,344 | $84,896 |
| 2019 | $2,750 | $208,080 | $124,848 | $83,232 |
| 2018 | $2,727 | $204,000 | $122,400 | $81,600 |
| 2017 | $2,716 | $200,000 | $120,000 | $80,000 |
| 2016 | $1,751 | $124,826 | $46,810 | $78,016 |
| 2015 | $1,624 | $122,952 | $46,107 | $76,845 |
| 2014 | $1,583 | $120,544 | $45,204 | $75,340 |
Property History
| Date | Event | Price | List to Sale | Price per Sq Ft | Prior Sale |
|---|---|---|---|---|---|
| 11/29/2025 11/29/25 | Price Changed | $369,999 | -4.9% | $607 / Sq Ft | |
| 10/22/2025 10/22/25 | For Sale | $389,000 | +3.7% | $638 / Sq Ft | |
| 06/24/2022 06/24/22 | Sold | $375,000 | +7.4% | $615 / Sq Ft | View Prior Sale |
| 06/08/2022 06/08/22 | Pending | -- | -- | -- | |
| 06/03/2022 06/03/22 | For Sale | $349,000 | -6.9% | $572 / Sq Ft | |
| 05/22/2022 05/22/22 | Off Market | $375,000 | -- | -- | |
| 05/19/2022 05/19/22 | For Sale | $349,000 | -- | $572 / Sq Ft |
Purchase History
| Date | Type | Sale Price | Title Company |
|---|---|---|---|
| Grant Deed | $375,000 | First American Title | |
| Grant Deed | $200,000 | California Title Company | |
| Interfamily Deed Transfer | -- | None Available | |
| Interfamily Deed Transfer | -- | None Available | |
| Interfamily Deed Transfer | -- | Ticor Title Company | |
| Grant Deed | $120,000 | Ticor Title Company | |
| Grant Deed | -- | Ticor Title San Diego | |
| Grant Deed | -- | None Available |
Mortgage History
| Date | Status | Loan Amount | Loan Type |
|---|---|---|---|
| Previous Owner | $194,000 | New Conventional | |
| Previous Owner | $95,000 | New Conventional | |
| Previous Owner | $343,750 | Unknown | |
| Closed | $0 | VA |
Source: San Diego MLS
MLS Number: 250042239
APN: 626-161-09-09
Disclaimer: Certain information contained herein is derived from information provided by parties other than Homes.com. All information provided is deemed reliable, but is not guaranteed to be accurate and should be independently verified.
![]() This information is deemed reliable but not guaranteed. You should rely on this information only to decide whether or not to further investigate a particular property.
This information is deemed reliable but not guaranteed. You should rely on this information only to decide whether or not to further investigate a particular property.
BEFORE MAKING ANY OTHER DECISION, YOU SHOULD PERSONALLY INVESTIGATE THE FACTS (e.g. square footage and lot size) with the assistance of an appropriate professional. You may use this information only to identify properties you may be interested in investigating further. All uses except for personal, noncommercial use in accordance with the foregoing purpose are prohibited. Redistribution or copying of this information, any photographs or video tours is strictly
prohibited. This information is derived from the Internet Data Exchange (IDX) service provided by San Diego MLS. Displayed property listings may be held by a brokerage firm other than the broker and/or agent responsible for this display. The information and any photographs and video tours and the compilation from which they are derived is protected by copyright. Compilation © 2025 San Diego MLS.
- 530 11th St
- 647 12th St
- 940 Calla Ave Unit 15
- 570 Emory St
- 645 Florence St
- 1202 Donax Ave Unit 3
- 829 11th St
- 843 10th St
- 635 13th St Unit 36
- 627 13th St Unit 16
- 753 13th St
- 425 8th St
- 908 Florence St
- 432-34 8th St
- 413 Delaware St Unit 15
- 1381 Palm Ave Unit 37
- 1381 Palm Ave Unit 45
- 511 Sanderling Ln
- 528 Shorebird Way
- 504 Hummingbird Ln
- 940 Calla Ave Unit 8
- 564 13th St Unit Rear Unit
- 1202 Donax Ave Unit 8
- 631 13th St Unit 1
- 870 13th St
- 520 Delaware St
- 1011 12th St Unit 13
- 524 Turnstone Ln
- 378 7th St
- 514 Lark Way
- 1120 Imperial Beach Blvd
- 1435-1467 Elder Ave
- 1085 12th St Unit I
- 1479-1485 Elder Ave
- 1019 Imperial Beach Blvd
- 1077 Connecticut St Unit 2
- 1245 11th St
- 1734 Dahlia Ave Unit 2
- 1733 Dahlia Ave
- 363 Palm Ave
