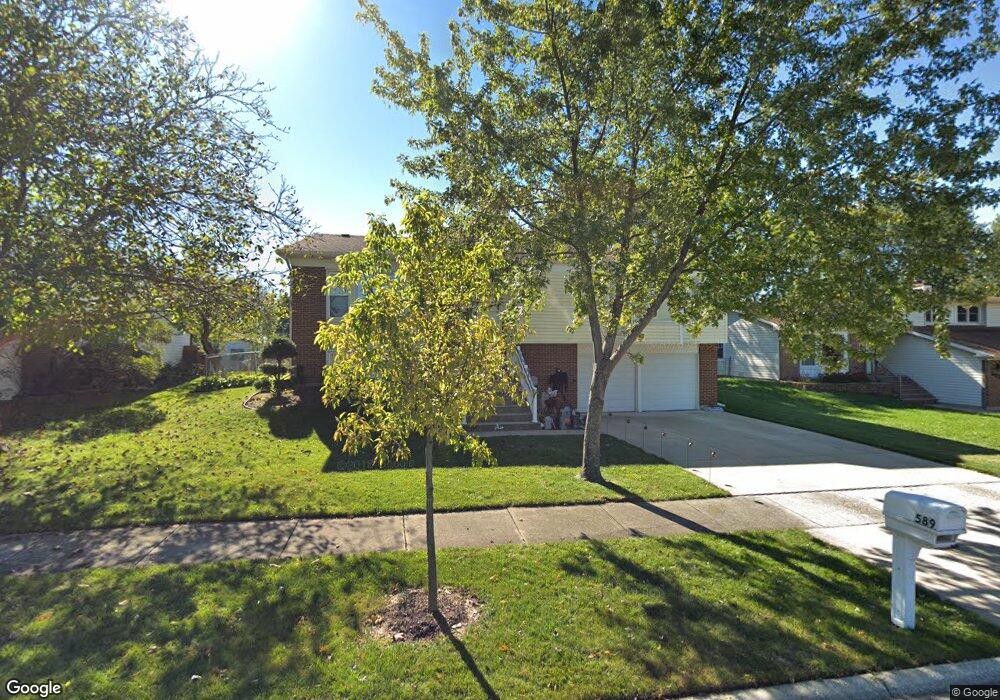
589 Cambridge Way Unit 6 Bolingbrook, IL 60440
West 83rd NeighborhoodEstimated Value: $416,000 - $418,000
3
Beds
3
Baths
1,422
Sq Ft
$293/Sq Ft
Est. Value
About This Home
This home is located at 589 Cambridge Way Unit 6, Bolingbrook, IL 60440 and is currently estimated at $416,581, approximately $292 per square foot. 589 Cambridge Way Unit 6 is a home located in DuPage County with nearby schools including William F. Murphy Elementary School, Thomas Jefferson Junior High School, and Downers Grove South High School.
Ownership History
Date
Name
Owned For
Owner Type
Purchase Details
Closed on
Dec 30, 2010
Sold by
Sfura Rose and Sfura Michael
Bought by
Karum Michael I and Rowden Ashley L
Current Estimated Value
Home Financials for this Owner
Home Financials are based on the most recent Mortgage that was taken out on this home.
Original Mortgage
$204,249
Outstanding Balance
$139,051
Interest Rate
4.75%
Mortgage Type
FHA
Estimated Equity
$277,530
Purchase Details
Closed on
Aug 20, 2006
Sold by
Sfura Michael G
Bought by
Sfura Michael G and Sfura Rose
Home Financials for this Owner
Home Financials are based on the most recent Mortgage that was taken out on this home.
Original Mortgage
$234,800
Interest Rate
7.9%
Mortgage Type
Balloon
Purchase Details
Closed on
Oct 29, 2003
Sold by
Doyle Gary D and Doyle Karen
Bought by
Soderlund Gary R and Soderlund Ellen L
Home Financials for this Owner
Home Financials are based on the most recent Mortgage that was taken out on this home.
Original Mortgage
$120,000
Interest Rate
6.08%
Mortgage Type
Purchase Money Mortgage
Create a Home Valuation Report for This Property
The Home Valuation Report is an in-depth analysis detailing your home's value as well as a comparison with similar homes in the area
Home Values in the Area
Average Home Value in this Area
Purchase History
| Date | Buyer | Sale Price | Title Company |
|---|---|---|---|
| Karum Michael I | $207,000 | Citywide Title Corporation | |
| Sfura Michael G | -- | Prairie Title | |
| Soderlund Gary R | $150,000 | Pntn |
Source: Public Records
Mortgage History
| Date | Status | Borrower | Loan Amount |
|---|---|---|---|
| Open | Karum Michael I | $204,249 | |
| Previous Owner | Sfura Michael G | $234,800 | |
| Previous Owner | Soderlund Gary R | $120,000 |
Source: Public Records
Tax History Compared to Growth
Tax History
| Year | Tax Paid | Tax Assessment Tax Assessment Total Assessment is a certain percentage of the fair market value that is determined by local assessors to be the total taxable value of land and additions on the property. | Land | Improvement |
|---|---|---|---|---|
| 2024 | $8,448 | $111,137 | $56,155 | $54,982 |
| 2023 | $8,058 | $101,430 | $51,250 | $50,180 |
| 2022 | $7,482 | $92,210 | $46,590 | $45,620 |
| 2021 | $7,147 | $88,720 | $44,830 | $43,890 |
| 2020 | $7,010 | $87,120 | $44,020 | $43,100 |
| 2019 | $6,846 | $83,360 | $42,120 | $41,240 |
| 2018 | $6,578 | $78,230 | $39,530 | $38,700 |
| 2017 | $6,383 | $75,590 | $38,200 | $37,390 |
| 2016 | $6,324 | $72,860 | $36,820 | $36,040 |
| 2015 | $6,375 | $70,050 | $35,400 | $34,650 |
| 2014 | $6,845 | $73,730 | $37,260 | $36,470 |
| 2013 | $6,714 | $73,910 | $37,350 | $36,560 |
Source: Public Records
Map
Nearby Homes
- 550 Piccadilly Ln
- 6305 Sandbelt Dr Unit 33003
- 6293 Sandbelt Dr Unit 34006
- 649 Sheffield Ln
- 722 N Pinecrest Rd
- 8327 Chelsea Ln
- 2921 Autumn Dr
- 2710 Northcreek Dr Unit 1804
- 1018 Rain Tree Dr
- 2721 Zurich Ln
- 411 Liberty Dr Unit 2
- 800 N Ashbury Ave Unit 8
- 725 N Ashbury Ave
- 8202 Piers Dr Unit 1302
- 2212 Wharf Dr Unit 2102
- 427 Charlestown Dr
- 419 Charlestown Dr
- 8119 Leawood Ln
- 8040 Geneva St
- 8224 Lindenwood Ln
- 585 Cambridge Way
- 593 Cambridge Way
- 586 Buckingham Way
- 590 Buckingham Way
- 582 Buckingham Way
- 581 Cambridge Way
- 597 Cambridge Way
- 594 Buckingham Way
- 605 Piccadilly Ln
- 577 Cambridge Way
- 578 Buckingham Way
- 594 Cambridge Way
- 598 Buckingham Way
- 582 Cambridge Way
- 601 Piccadilly Ln
- 574 Buckingham Way
- 578 Cambridge Way
- 573 Cambridge Way
- 585 Buckingham Way
- 581 Buckingham Way