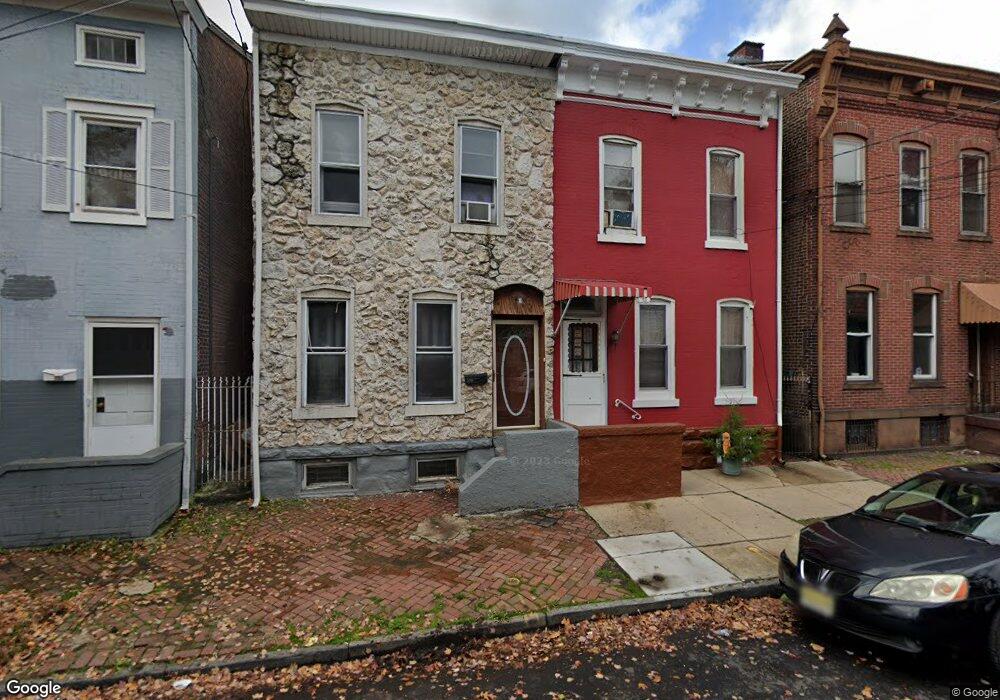
589 Centre St Trenton, NJ 08611
South Trenton NeighborhoodEstimated Value: $175,000 - $194,000
--
Bed
--
Bath
1,472
Sq Ft
$128/Sq Ft
Est. Value
About This Home
This home is located at 589 Centre St, Trenton, NJ 08611 and is currently estimated at $188,341, approximately $127 per square foot. 589 Centre St is a home located in Mercer County with nearby schools including Parker Elementary School, Grace A Dunn Middle School, and Trenton Central High School - Main Campus.
Ownership History
Date
Name
Owned For
Owner Type
Purchase Details
Closed on
Mar 3, 2016
Sold by
Najarro Avatos Eleazar
Bought by
Najarro Avalos Eleazar and Najarro Luz Elena
Current Estimated Value
Home Financials for this Owner
Home Financials are based on the most recent Mortgage that was taken out on this home.
Original Mortgage
$87,965
Outstanding Balance
$66,189
Interest Rate
4.87%
Mortgage Type
FHA
Estimated Equity
$122,152
Purchase Details
Closed on
Aug 25, 2006
Sold by
Luff Asset Mgmt Co Llc
Bought by
Avalos Eleazar
Home Financials for this Owner
Home Financials are based on the most recent Mortgage that was taken out on this home.
Original Mortgage
$100,180
Interest Rate
6.52%
Create a Home Valuation Report for This Property
The Home Valuation Report is an in-depth analysis detailing your home's value as well as a comparison with similar homes in the area
Home Values in the Area
Average Home Value in this Area
Purchase History
| Date | Buyer | Sale Price | Title Company |
|---|---|---|---|
| Najarro Avalos Eleazar | -- | None Available | |
| Avalos Eleazar | $105,000 | -- |
Source: Public Records
Mortgage History
| Date | Status | Borrower | Loan Amount |
|---|---|---|---|
| Open | Najarro Avalos Eleazar | $87,965 | |
| Closed | Avalos Eleazar | $100,180 |
Source: Public Records
Tax History Compared to Growth
Tax History
| Year | Tax Paid | Tax Assessment Tax Assessment Total Assessment is a certain percentage of the fair market value that is determined by local assessors to be the total taxable value of land and additions on the property. | Land | Improvement |
|---|---|---|---|---|
| 2025 | $3,672 | $63,300 | $7,700 | $55,600 |
| 2024 | $3,524 | $63,300 | $7,700 | $55,600 |
| 2023 | $3,524 | $63,300 | $7,700 | $55,600 |
| 2022 | $3,455 | $63,300 | $7,700 | $55,600 |
| 2021 | $3,515 | $63,300 | $7,700 | $55,600 |
| 2020 | $3,504 | $63,300 | $7,700 | $55,600 |
| 2019 | $3,447 | $63,300 | $7,700 | $55,600 |
| 2018 | $3,300 | $63,300 | $7,700 | $55,600 |
| 2017 | $3,137 | $63,300 | $7,700 | $55,600 |
| 2016 | $3,584 | $62,300 | $12,700 | $49,600 |
| 2015 | $3,572 | $62,300 | $12,700 | $49,600 |
| 2014 | $3,555 | $62,300 | $12,700 | $49,600 |
Source: Public Records
Map
Nearby Homes