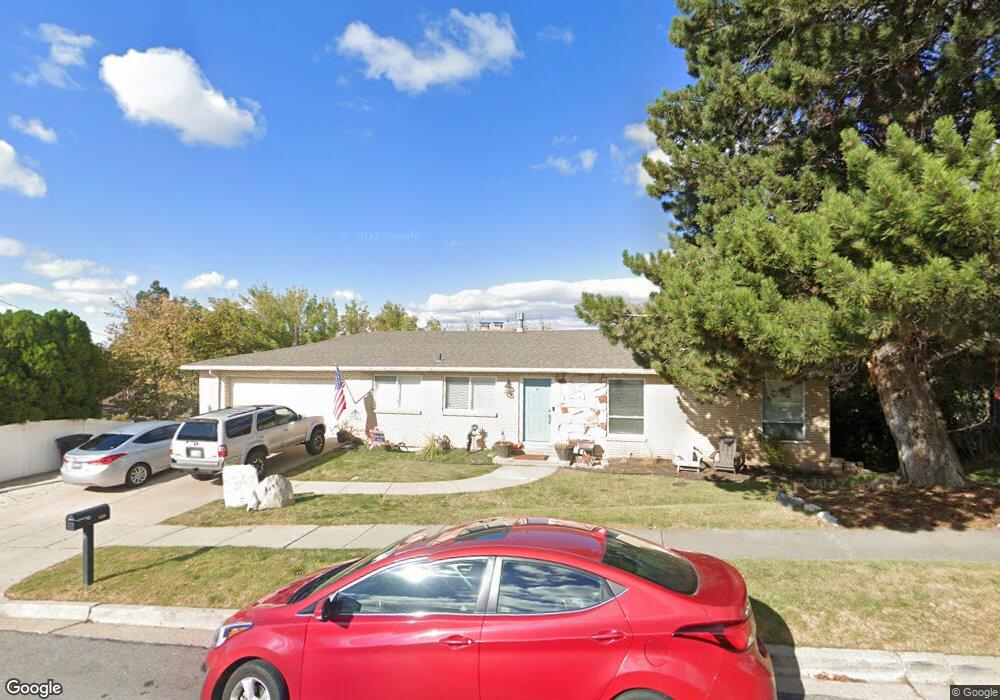
589 E 2150 S Bountiful, UT 84010
Estimated Value: $600,000 - $656,000
5
Beds
3
Baths
3,204
Sq Ft
$196/Sq Ft
Est. Value
About This Home
This home is located at 589 E 2150 S, Bountiful, UT 84010 and is currently estimated at $629,102, approximately $196 per square foot. 589 E 2150 S is a home located in Davis County with nearby schools including Muir School, Mueller Park Junior High School, and Bountiful High School.
Ownership History
Date
Name
Owned For
Owner Type
Purchase Details
Closed on
May 6, 2010
Sold by
Bank Of Utah
Bought by
Rasmussen Eric T and Rasmussen Jana
Current Estimated Value
Home Financials for this Owner
Home Financials are based on the most recent Mortgage that was taken out on this home.
Original Mortgage
$252,598
Outstanding Balance
$167,152
Interest Rate
4.87%
Mortgage Type
FHA
Estimated Equity
$461,950
Purchase Details
Closed on
Jul 16, 2009
Sold by
Kearns James L
Bought by
3255 Interest Bank Of Utah and James L Kearns Roth Ira
Purchase Details
Closed on
Jun 3, 2009
Sold by
Vernal Investments Llc
Bought by
Kearns James L
Purchase Details
Closed on
Apr 13, 2009
Sold by
Angus Douglas M and Angus Denise B
Bought by
Vernal 2 Investments Llc
Purchase Details
Closed on
Feb 19, 2002
Sold by
Loveridge William Wallace and Loveridge William
Bought by
Angus Douglas M
Create a Home Valuation Report for This Property
The Home Valuation Report is an in-depth analysis detailing your home's value as well as a comparison with similar homes in the area
Purchase History
| Date | Buyer | Sale Price | Title Company |
|---|---|---|---|
| Rasmussen Eric T | -- | First American Title | |
| 3255 Interest Bank Of Utah | -- | Accommodation | |
| Kearns James L | -- | Inwest Title Services In | |
| Vernal 2 Investments Llc | -- | Inwest Title Services Inc | |
| Angus Douglas M | -- | Surety Title Agency |
Source: Public Records
Mortgage History
| Date | Status | Borrower | Loan Amount |
|---|---|---|---|
| Open | Rasmussen Eric T | $252,598 |
Source: Public Records
Tax History
| Year | Tax Paid | Tax Assessment Tax Assessment Total Assessment is a certain percentage of the fair market value that is determined by local assessors to be the total taxable value of land and additions on the property. | Land | Improvement |
|---|---|---|---|---|
| 2025 | $3,386 | $309,100 | $132,620 | $176,480 |
| 2024 | $3,264 | $309,100 | $122,295 | $186,805 |
| 2023 | $3,160 | $543,000 | $221,489 | $321,511 |
| 2022 | $3,315 | $312,950 | $117,905 | $195,045 |
| 2021 | $2,880 | $415,000 | $175,219 | $239,781 |
| 2020 | $2,559 | $370,000 | $136,088 | $233,912 |
| 2019 | $2,531 | $357,000 | $140,676 | $216,324 |
| 2018 | $2,377 | $363,000 | $137,828 | $225,172 |
| 2016 | $2,196 | $165,880 | $52,834 | $113,046 |
| 2015 | $2,165 | $154,495 | $52,834 | $101,661 |
Source: Public Records
Map
Nearby Homes
- 761 San Simeon Way
- 2053 S 350 E Unit 7
- 1886 S Jeri Dr
- 2059 S 350 E Unit 6
- 295 E 2050 S Unit 1
- 2046 S 350 E Unit 4
- 320 E 2100 S
- 2038 S 350 E Unit 3
- 831 E San Simeon Way S
- 296 E 2050 S Unit 2
- 2136 S 900 E
- 2292 S 250 E
- 1761 S Davis Blvd
- 2273 S 200 E
- 610 Meadowlark Ln
- 631 E 1700 S
- 188 E 2050 S Unit D3
- 994 Deborah Dr
- 110 2250 S
- 2064 S Orchard Dr
Your Personal Tour Guide
Ask me questions while you tour the home.