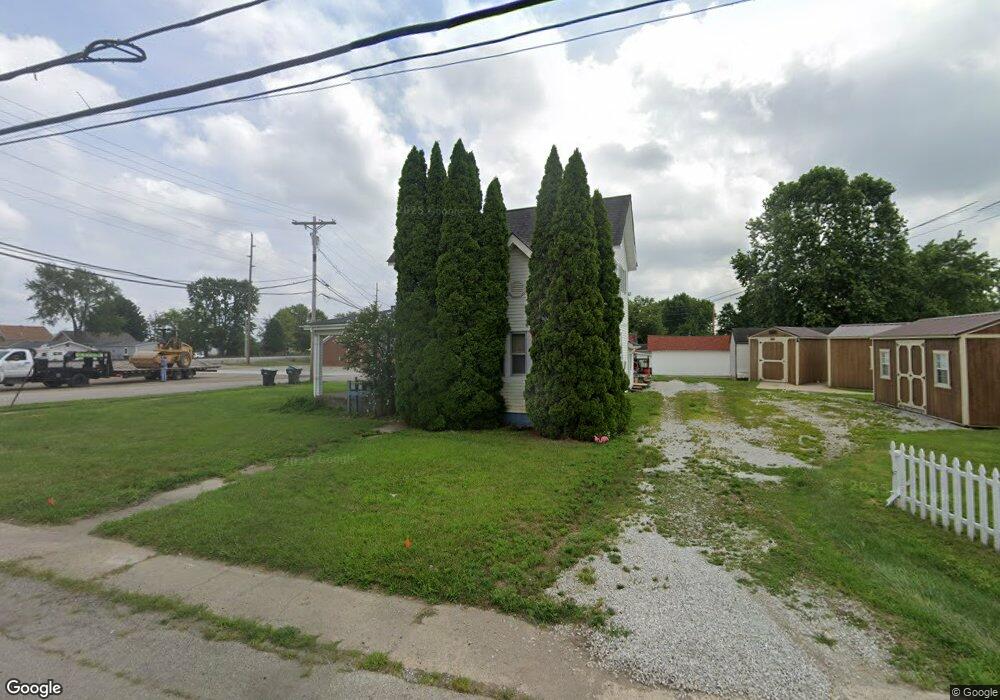
589 E Main St Whiteland, IN 46184
Estimated Value: $226,000 - $251,000
About This Home
This home is located at 589 E Main St, Whiteland, IN 46184 and is currently estimated at $237,000, approximately $132 per square foot. 589 E Main St is a home located in Johnson County with nearby schools including Whiteland Elementary School, Clark-Pleasant Middle School, and Whiteland Community High School.
Ownership History
We collect this data history from publicly available records. To have your information removed, we recommend requesting removal directly through your county’s website.
Purchase Details
Home Financials for this Owner
Home Financials are based on the most recent Mortgage that was taken out on this home.Home Values in the Area
Average Home Value in this Area
Purchase History
We collect this data history from publicly available records. To have your information removed, we recommend requesting removal directly through your county’s website.
| Date | Buyer | Sale Price | Title Company |
|---|---|---|---|
| $205,000 | Ata National Title |
Mortgage History
We collect this data history from publicly available records. To have your information removed, we recommend requesting removal directly through your county’s website.
| Date | Status | Borrower | Loan Amount |
|---|---|---|---|
| Open | $252,000 |
Tax History
We collect this data history from publicly available records. To have your information removed, we recommend requesting removal directly through your county’s website.
| Year | Tax Paid | Tax Assessment Tax Assessment Total Assessment is a certain percentage of the fair market value that is determined by local assessors to be the total taxable value of land and additions on the property. | Land | Improvement |
|---|---|---|---|---|
| 2025 | $4,029 | $204,800 | $33,900 | $170,900 |
| 2024 | $3,522 | $168,600 | $34,400 | $134,200 |
| 2023 | $3,412 | $163,600 | $34,400 | $129,200 |
| 2022 | $2,788 | $134,200 | $22,900 | $111,300 |
| 2021 | $2,528 | $121,200 | $22,900 | $98,300 |
| 2020 | $2,334 | $111,200 | $22,900 | $88,300 |
| 2019 | $2,334 | $111,200 | $22,900 | $88,300 |
| 2018 | $2,215 | $108,600 | $17,600 | $91,000 |
| 2017 | $2,160 | $107,500 | $17,600 | $89,900 |
| 2016 | $2,150 | $107,500 | $17,600 | $89,900 |
| 2014 | $1,944 | $97,200 | $19,600 | $77,600 |
| 2013 | $1,944 | $97,200 | $19,600 | $77,600 |
Map
- 271 Walker Dr
- 620 Pearl St
- 650 E Pearl St
- 800 E Pearl St
- 810 Pearl St
- 189 Pinedale Dr
- 831 E Pearl St
- 120 Ames Dr
- 131 Ames Dr
- 657 Whiteland Rd
- 545 Whiteland Rd
- 140 Ames Dr
- 70 Freeman St
- 150 Ames Dr
- 100 Ames Dr
- 801 Blaine Dr
- 120 Freeman St
- 920 Saddlebrook Farms Blvd
- 830 Saddlebrook Farms Blvd
- 40 Wilkins St
Ask me questions while you tour the home.