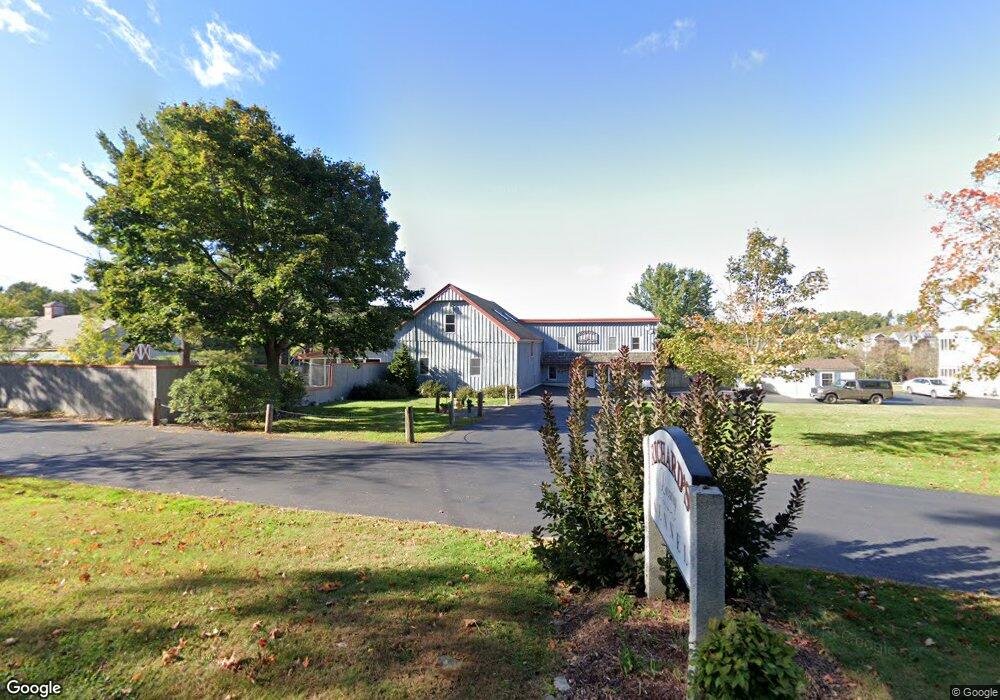
589 Elm St Leominster, MA 01453
Estimated Value: $1,096,758
--
Bed
3
Baths
--
Sq Ft
1.92
Acres
About This Home
This home is located at 589 Elm St, Leominster, MA 01453 and is currently estimated at $1,096,758. 589 Elm St is a home located in Worcester County with nearby schools including Leominster High School, St. Leo School, and St. Anna Catholic School.
Ownership History
Date
Name
Owned For
Owner Type
Purchase Details
Closed on
Oct 26, 2015
Sold by
Richard Stephen P
Bought by
Elm Street Rt
Current Estimated Value
Purchase Details
Closed on
Oct 9, 2007
Sold by
Richard Stephen P and Richard Rhonda L
Bought by
Lola A Richard Irt
Purchase Details
Closed on
Dec 20, 1996
Sold by
Richard Paul D and Richard Lola
Bought by
Richard Stephen P and Richard Rhonda L
Home Financials for this Owner
Home Financials are based on the most recent Mortgage that was taken out on this home.
Original Mortgage
$280,000
Interest Rate
7.62%
Mortgage Type
Purchase Money Mortgage
Create a Home Valuation Report for This Property
The Home Valuation Report is an in-depth analysis detailing your home's value as well as a comparison with similar homes in the area
Home Values in the Area
Average Home Value in this Area
Purchase History
| Date | Buyer | Sale Price | Title Company |
|---|---|---|---|
| Elm Street Rt | -- | -- | |
| Lola A Richard Irt | -- | -- | |
| Richard Stephen P | $280,000 | -- |
Source: Public Records
Mortgage History
| Date | Status | Borrower | Loan Amount |
|---|---|---|---|
| Previous Owner | Richard Stephen P | $280,000 |
Source: Public Records
Tax History Compared to Growth
Tax History
| Year | Tax Paid | Tax Assessment Tax Assessment Total Assessment is a certain percentage of the fair market value that is determined by local assessors to be the total taxable value of land and additions on the property. | Land | Improvement |
|---|---|---|---|---|
| 2025 | $10,245 | $730,200 | $164,600 | $565,600 |
| 2024 | $9,452 | $651,400 | $156,500 | $494,900 |
| 2023 | $9,072 | $583,800 | $136,200 | $447,600 |
| 2022 | $8,103 | $489,300 | $119,600 | $369,700 |
| 2021 | $8,420 | $464,400 | $95,200 | $369,200 |
| 2020 | $7,616 | $423,600 | $95,200 | $328,400 |
| 2019 | $7,781 | $419,700 | $91,300 | $328,400 |
| 2018 | $7,558 | $391,000 | $88,800 | $302,200 |
| 2017 | $6,681 | $338,600 | $83,000 | $255,600 |
| 2016 | $6,365 | $325,100 | $83,000 | $242,100 |
| 2015 | $6,320 | $325,100 | $83,000 | $242,100 |
| 2014 | $6,816 | $360,800 | $87,500 | $273,300 |
Source: Public Records
Map
Nearby Homes