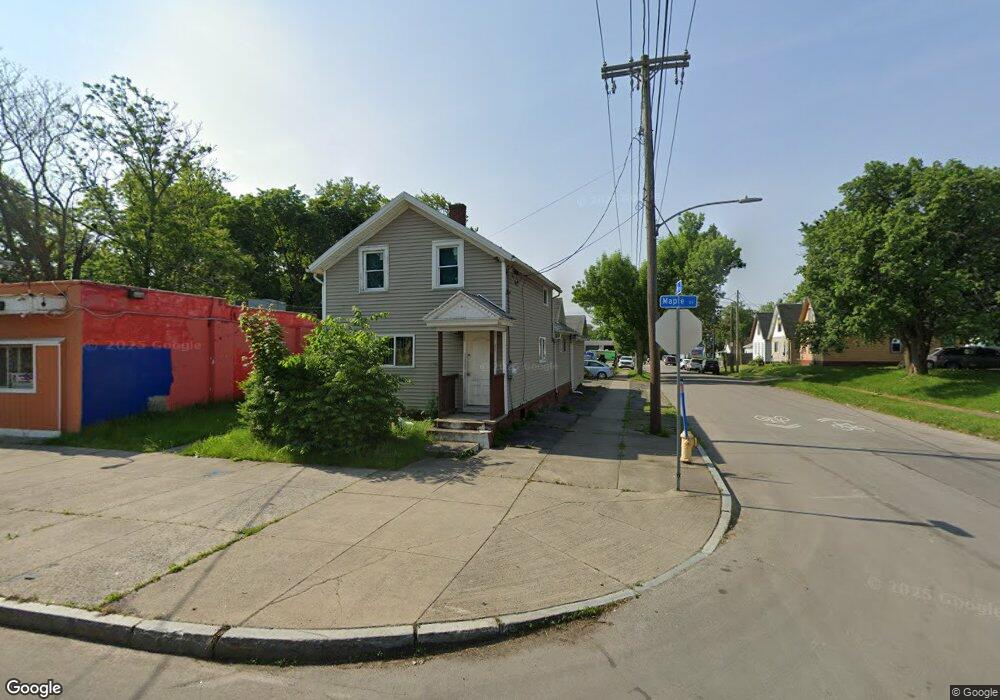
589 Maple St Rochester, NY 14611
Dutchtown NeighborhoodEstimated Value: $108,756
Studio
--
Bath
6,104
Sq Ft
$18/Sq Ft
Est. Value
About This Home
This home is located at 589 Maple St, Rochester, NY 14611 and is currently estimated at $108,756, approximately $17 per square foot. 589 Maple St is a home located in Monroe County with nearby schools including Enrico Fermi School No. 17, John Williams School No. 5, and Dr. Louis A. Cerulli School No. 34.
Ownership History
Date
Name
Owned For
Owner Type
Purchase Details
Closed on
Jan 11, 2023
Sold by
Saleh Yasser
Bought by
Sierra Samuel
Current Estimated Value
Home Financials for this Owner
Home Financials are based on the most recent Mortgage that was taken out on this home.
Original Mortgage
$75,000
Outstanding Balance
$53,421
Interest Rate
5.73%
Mortgage Type
Seller Take Back
Estimated Equity
$55,335
Purchase Details
Closed on
Aug 30, 2007
Sold by
Saleh Yasser
Bought by
Ez-In Market Inc
Purchase Details
Closed on
Feb 15, 2007
Sold by
Rebman Rodney
Bought by
Saleh Yasser
Create a Home Valuation Report for This Property
The Home Valuation Report is an in-depth analysis detailing your home's value as well as a comparison with similar homes in the area
Home Values in the Area
Average Home Value in this Area
Purchase History
| Date | Buyer | Sale Price | Title Company |
|---|---|---|---|
| Sierra Samuel | $75,000 | -- | |
| Ez-In Market Inc | -- | -- | |
| Saleh Yasser | $170,000 | -- |
Source: Public Records
Mortgage History
| Date | Status | Borrower | Loan Amount |
|---|---|---|---|
| Open | Sierra Samuel | $75,000 |
Source: Public Records
Tax History
| Year | Tax Paid | Tax Assessment Tax Assessment Total Assessment is a certain percentage of the fair market value that is determined by local assessors to be the total taxable value of land and additions on the property. | Land | Improvement |
|---|---|---|---|---|
| 2024 | $1,339 | $146,400 | $17,500 | $128,900 |
| 2023 | $1,552 | $125,000 | $17,500 | $107,500 |
| 2022 | $1,642 | $125,000 | $17,500 | $107,500 |
| 2021 | $1,687 | $125,000 | $17,500 | $107,500 |
| 2020 | $1,895 | $125,000 | $17,500 | $107,500 |
| 2019 | $1,778 | $125,000 | $17,500 | $107,500 |
| 2018 | $0 | $125,000 | $17,500 | $107,500 |
| 2017 | $0 | $125,000 | $17,500 | $107,500 |
| 2016 | $1,778 | $125,000 | $17,500 | $107,500 |
| 2015 | $7,794 | $125,000 | $17,500 | $107,500 |
| 2014 | $7,794 | $125,000 | $17,500 | $107,500 |
Source: Public Records
Map
Nearby Homes