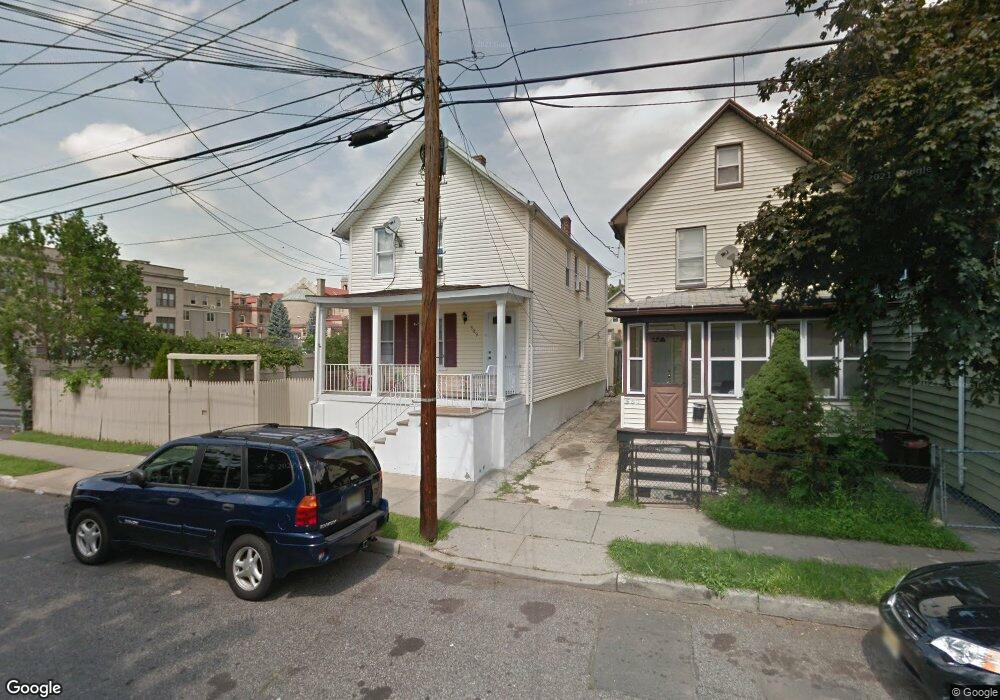
589 Mcchesney St Orange, NJ 07050
Estimated Value: $411,000 - $614,000
--
Bed
--
Bath
1,582
Sq Ft
$305/Sq Ft
Est. Value
About This Home
This home is located at 589 Mcchesney St, Orange, NJ 07050 and is currently estimated at $481,910, approximately $304 per square foot. 589 Mcchesney St is a home located in Essex County.
Ownership History
Date
Name
Owned For
Owner Type
Purchase Details
Closed on
Sep 27, 2018
Sold by
Lyssa Llc
Bought by
Singh Narain and Singh Avinash M
Current Estimated Value
Purchase Details
Closed on
Jun 17, 2005
Sold by
Liendo Cinthya
Bought by
Singh Jienarine and Singh Yoginie
Home Financials for this Owner
Home Financials are based on the most recent Mortgage that was taken out on this home.
Original Mortgage
$147,000
Interest Rate
5.78%
Purchase Details
Closed on
Jun 28, 2002
Sold by
Pantoja Jose
Bought by
Liendo Cinthya and Liendo Magaly
Home Financials for this Owner
Home Financials are based on the most recent Mortgage that was taken out on this home.
Original Mortgage
$146,667
Interest Rate
6.92%
Mortgage Type
FHA
Purchase Details
Closed on
Jul 15, 1999
Sold by
Orange
Bought by
Pantosa Jose
Purchase Details
Closed on
May 5, 1995
Sold by
Glazer Georgina
Bought by
Gauthier Gandy
Home Financials for this Owner
Home Financials are based on the most recent Mortgage that was taken out on this home.
Original Mortgage
$112,000
Interest Rate
8.34%
Mortgage Type
FHA
Create a Home Valuation Report for This Property
The Home Valuation Report is an in-depth analysis detailing your home's value as well as a comparison with similar homes in the area
Home Values in the Area
Average Home Value in this Area
Purchase History
| Date | Buyer | Sale Price | Title Company |
|---|---|---|---|
| Singh Narain | $135,000 | -- | |
| Singh Jienarine | $187,000 | -- | |
| Liendo Cinthya | $149,000 | -- | |
| Pantosa Jose | $11,500 | -- | |
| Gauthier Gandy | $115,000 | -- |
Source: Public Records
Mortgage History
| Date | Status | Borrower | Loan Amount |
|---|---|---|---|
| Previous Owner | Singh Jienarine | $147,000 | |
| Previous Owner | Liendo Cinthya | $146,667 | |
| Previous Owner | Gauthier Gandy | $112,000 |
Source: Public Records
Tax History Compared to Growth
Tax History
| Year | Tax Paid | Tax Assessment Tax Assessment Total Assessment is a certain percentage of the fair market value that is determined by local assessors to be the total taxable value of land and additions on the property. | Land | Improvement |
|---|---|---|---|---|
| 2025 | $8,826 | $236,800 | $69,400 | $167,400 |
| 2024 | $8,826 | $236,800 | $69,400 | $167,400 |
| 2023 | $8,207 | $236,800 | $69,400 | $167,400 |
| 2022 | $8,207 | $236,800 | $69,400 | $167,400 |
| 2021 | $7,456 | $129,000 | $44,000 | $85,000 |
| 2020 | $7,233 | $129,000 | $44,000 | $85,000 |
| 2019 | $6,856 | $129,000 | $44,000 | $85,000 |
| 2018 | $6,747 | $129,000 | $44,000 | $85,000 |
| 2017 | $6,282 | $129,000 | $44,000 | $85,000 |
| 2016 | $6,164 | $129,000 | $44,000 | $85,000 |
| 2015 | $6,002 | $129,000 | $44,000 | $85,000 |
| 2014 | $5,739 | $129,000 | $44,000 | $85,000 |
Source: Public Records
Map
Nearby Homes
- 585 Mcchesney St
- 567 Mcchesney St
- 527 Valley St
- 540 Liberty St
- 468 Valley St
- 548 Tremont Ave
- 412 S Valley Rd
- 530 Lincoln Ave
- 562 Lincoln Ave
- 656 Scotland Rd
- 669 Scotland Rd
- 669 Scotland Rd Unit 2
- 433 Lincoln Ave Unit B8
- 433 Lincoln Ave Unit C002G
- 433 Lincoln Ave
- 7 Lawrence Ave
- 347 S Jefferson St
- 350 Scotland Rd
- 350 Scotland Rd Unit 303
- 350 Scotland Rd Unit 304
- 587 Mcchesney St
- 583 Mcchesney St
- 579 Mcchesney St
- 588 Morrow St
- 584 Morrow St
- 590 Mcchesney St
- 590 Mcchesney St Unit 1
- 592 Mcchesney St
- 592 Mcchesney St Unit 2
- 584 Mcchesney St
- 576 Morrow St
- 596 Mcchesney St
- 574 Mcchesney St
- 598 Mcchesney St
- 580 Mcchesney St
- 578 Mcchesney St
- 576 Mcchesney St
- 600 Mcchesney St
- 602 Mcchesney St
- 602 Mcchesney St Unit 2