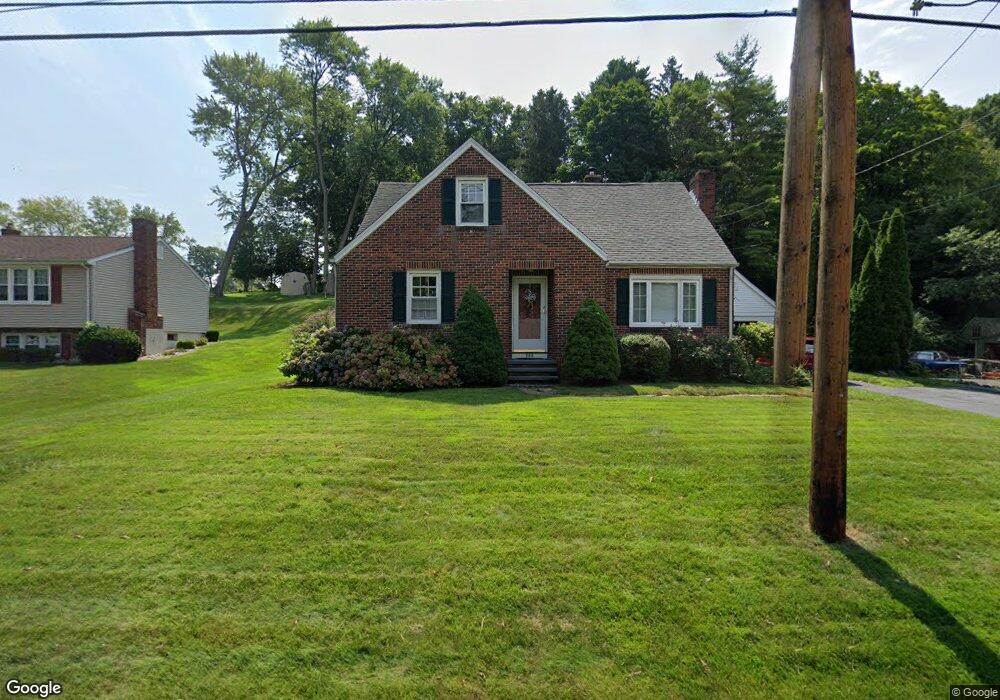
589 N Elm St Wallingford, CT 06492
Estimated Value: $408,000 - $467,000
4
Beds
2
Baths
1,521
Sq Ft
$293/Sq Ft
Est. Value
About This Home
This home is located at 589 N Elm St, Wallingford, CT 06492 and is currently estimated at $445,585, approximately $292 per square foot. 589 N Elm St is a home located in New Haven County with nearby schools including Moses Y Beach Elementary School, Rock Hill Elementary School, and Dag Hammarskjold Middle School.
Ownership History
Date
Name
Owned For
Owner Type
Purchase Details
Closed on
Jun 11, 2024
Sold by
Wrinn Richard J and Wrinn Sandra M
Bought by
Richard S Wrinn Lt and Wrinn
Current Estimated Value
Purchase Details
Closed on
Apr 18, 1972
Bought by
Wrinn Richard J and Wrinn Sandra M
Create a Home Valuation Report for This Property
The Home Valuation Report is an in-depth analysis detailing your home's value as well as a comparison with similar homes in the area
Home Values in the Area
Average Home Value in this Area
Purchase History
| Date | Buyer | Sale Price | Title Company |
|---|---|---|---|
| Richard S Wrinn Lt | -- | None Available | |
| Richard S Wrinn Lt | -- | None Available | |
| Wrinn Richard J | -- | -- |
Source: Public Records
Mortgage History
| Date | Status | Borrower | Loan Amount |
|---|---|---|---|
| Previous Owner | Wrinn Richard J | $200,000 | |
| Previous Owner | Wrinn Richard J | $132,554 | |
| Previous Owner | Wrinn Richard J | $251,950 |
Source: Public Records
Tax History Compared to Growth
Tax History
| Year | Tax Paid | Tax Assessment Tax Assessment Total Assessment is a certain percentage of the fair market value that is determined by local assessors to be the total taxable value of land and additions on the property. | Land | Improvement |
|---|---|---|---|---|
| 2025 | $6,990 | $289,800 | $115,100 | $174,700 |
| 2024 | $6,193 | $202,000 | $96,000 | $106,000 |
| 2023 | $5,927 | $202,000 | $96,000 | $106,000 |
| 2022 | $5,866 | $202,000 | $96,000 | $106,000 |
| 2021 | $5,761 | $202,000 | $96,000 | $106,000 |
| 2020 | $5,572 | $190,900 | $95,100 | $95,800 |
| 2019 | $5,572 | $190,900 | $95,100 | $95,800 |
| 2018 | $5,467 | $190,900 | $95,100 | $95,800 |
| 2017 | $5,450 | $190,900 | $95,100 | $95,800 |
| 2016 | $5,324 | $190,900 | $95,100 | $95,800 |
| 2015 | $5,302 | $193,000 | $95,100 | $97,900 |
| 2014 | $5,190 | $193,000 | $95,100 | $97,900 |
Source: Public Records
Map
Nearby Homes
- 4 Sunset Dr
- 6 Kovacs Place
- 1 Pine Glen Terrace
- 690 N Colony Rd Unit 15
- 49 High St
- 5 Stegos Dr
- 37 Laurelwood Dr
- 29 Curtis Ave
- 40 Lake St
- 43 Academy St
- 11 Westview Dr
- 85 N Colony St
- 530 Center St Unit C1
- 940 Durham Rd
- 230 Main St Unit 49
- 230 Main St Unit 18
- 230 Main St Unit 43
- 70 N Turnpike Rd Unit 21
- 67 Spring St
- 3 Trailside Dr