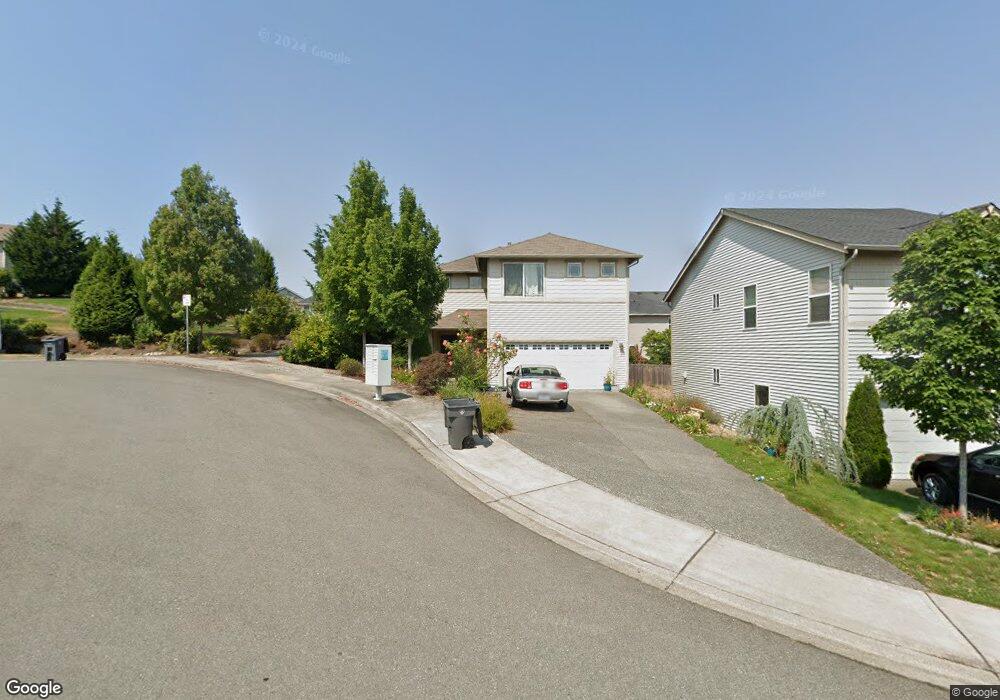
589 NW Stendahl Ct Poulsbo, WA 98370
Estimated Value: $499,553 - $577,000
3
Beds
3
Baths
1,580
Sq Ft
$333/Sq Ft
Est. Value
About This Home
This home is located at 589 NW Stendahl Ct, Poulsbo, WA 98370 and is currently estimated at $525,888, approximately $332 per square foot. 589 NW Stendahl Ct is a home located in Kitsap County with nearby schools including Vinland Elementary School, Poulsbo Middle School, and North Kitsap High School.
Ownership History
Date
Name
Owned For
Owner Type
Purchase Details
Closed on
Jul 25, 2012
Sold by
Tweedy Leslie A
Bought by
Tweedy Leslie A and Tweedy James
Current Estimated Value
Home Financials for this Owner
Home Financials are based on the most recent Mortgage that was taken out on this home.
Original Mortgage
$262,962
Outstanding Balance
$182,205
Interest Rate
3.75%
Mortgage Type
FHA
Estimated Equity
$343,683
Purchase Details
Closed on
Feb 1, 2008
Sold by
The Quadrant Corp
Bought by
Tweedy Leslie A
Home Financials for this Owner
Home Financials are based on the most recent Mortgage that was taken out on this home.
Original Mortgage
$280,947
Interest Rate
6.09%
Mortgage Type
Purchase Money Mortgage
Purchase Details
Closed on
Jan 15, 2008
Sold by
Viking Street Land Partners Llc
Bought by
The Quadrant Corp
Home Financials for this Owner
Home Financials are based on the most recent Mortgage that was taken out on this home.
Original Mortgage
$280,947
Interest Rate
6.09%
Mortgage Type
Purchase Money Mortgage
Create a Home Valuation Report for This Property
The Home Valuation Report is an in-depth analysis detailing your home's value as well as a comparison with similar homes in the area
Home Values in the Area
Average Home Value in this Area
Purchase History
| Date | Buyer | Sale Price | Title Company |
|---|---|---|---|
| Tweedy Leslie A | -- | None Available | |
| Tweedy Leslie A | $291,646 | First American Title Ins Co | |
| The Quadrant Corp | $2,622,722 | First American Title Ins Co |
Source: Public Records
Mortgage History
| Date | Status | Borrower | Loan Amount |
|---|---|---|---|
| Open | Tweedy Leslie A | $262,962 | |
| Closed | Tweedy Leslie A | $280,947 |
Source: Public Records
Tax History Compared to Growth
Tax History
| Year | Tax Paid | Tax Assessment Tax Assessment Total Assessment is a certain percentage of the fair market value that is determined by local assessors to be the total taxable value of land and additions on the property. | Land | Improvement |
|---|---|---|---|---|
| 2026 | $3,920 | $445,430 | $101,620 | $343,810 |
| 2025 | $3,920 | $445,430 | $101,620 | $343,810 |
| 2024 | $3,433 | $402,080 | $95,030 | $307,050 |
| 2023 | $3,631 | $418,240 | $95,030 | $323,210 |
| 2022 | $3,216 | $352,870 | $82,490 | $270,380 |
| 2021 | $3,111 | $316,320 | $73,910 | $242,410 |
| 2020 | $3,023 | $302,140 | $70,610 | $231,530 |
| 2019 | $2,835 | $283,540 | $65,990 | $217,550 |
| 2018 | $2,466 | $209,680 | $50,060 | $159,620 |
| 2017 | $2,351 | $209,680 | $50,060 | $159,620 |
| 2016 | $2,414 | $198,280 | $50,060 | $148,220 |
| 2015 | $2,332 | $192,580 | $50,060 | $142,520 |
| 2014 | -- | $184,590 | $50,060 | $134,530 |
| 2013 | -- | $184,590 | $50,060 | $134,530 |
Source: Public Records
Map
Nearby Homes
- 21032 Nordby Dr NW
- 0 NW Slippery Pig Way Unit NWM2261792
- 796 NW Cedar Ln
- 20310 NW Cedar Ln
- 31200 Washington 3
- 21772 NW Monterey Loop
- 21756 Windmill Loop NW
- 21781 Windmill Loop NW
- 21728 Urdahl Rd NW
- 21555 Urdahl Rd NW
- 21133 Viking Ave NW
- 21601 Viking Ave NW
- 21988 Urdahl Rd NW
- 434 NE Ohenry Ct
- 263 NE Max William Loop
- 1881 Claret Loop NW
- 20065 Regin Ct NE
- 402 NE Inspiration St
- 423 NE Inspiration St
- 22121 Jameson Ave NW
- 581 NW Stendahl Ct
- 573 Stendhal
- 573 NW Stendahl Ct
- 579 NW Nesvik Way
- 591 NW Stendahl Ct
- 557 NW Stendahl Ct
- 571 NW Nesvik Way
- 593 NW Stendahl Ct
- 588 NW Stendahl Ct
- 594 NW Stendahl Ct
- 551 NW Nesvik Way
- 582 NW Stendahl Ct
- 595 NW Stendahl Ct
- 535 NW Stendahl Ct
- 631 NW Nesvik Way
- 562 NW Stendahl Ct
- 597 NW Stendahl Ct
- 531 NW Nesvik Way
- 738 NW Rasmussen Ct