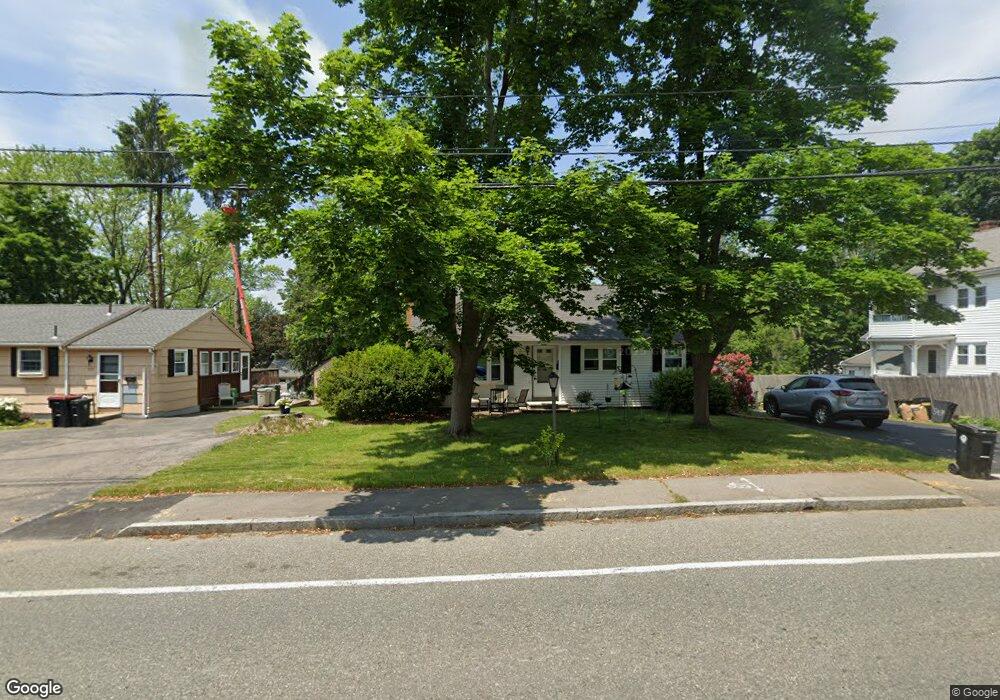
589 Pearl St Brockton, MA 02301
Estimated Value: $488,000 - $540,000
3
Beds
1
Bath
1,446
Sq Ft
$361/Sq Ft
Est. Value
About This Home
This home is located at 589 Pearl St, Brockton, MA 02301 and is currently estimated at $522,079, approximately $361 per square foot. 589 Pearl St is a home located in Plymouth County with nearby schools including Hancock Elementary School, Manthala George Jr. School, and Louis F Angelo Elementary School.
Ownership History
Date
Name
Owned For
Owner Type
Purchase Details
Closed on
Apr 30, 2002
Sold by
Hernandez Wilfredo and Christmans Rhoda L
Bought by
Riseman Aaron M and Riseman Lisa L
Current Estimated Value
Home Financials for this Owner
Home Financials are based on the most recent Mortgage that was taken out on this home.
Original Mortgage
$151,900
Interest Rate
7.05%
Mortgage Type
Purchase Money Mortgage
Purchase Details
Closed on
May 4, 1989
Sold by
Tierney Brian M
Bought by
Hernandez Wilfredo
Home Financials for this Owner
Home Financials are based on the most recent Mortgage that was taken out on this home.
Original Mortgage
$124,200
Interest Rate
11.13%
Mortgage Type
Purchase Money Mortgage
Create a Home Valuation Report for This Property
The Home Valuation Report is an in-depth analysis detailing your home's value as well as a comparison with similar homes in the area
Home Values in the Area
Average Home Value in this Area
Purchase History
| Date | Buyer | Sale Price | Title Company |
|---|---|---|---|
| Riseman Aaron M | $189,900 | -- | |
| Hernandez Wilfredo | $138,000 | -- |
Source: Public Records
Mortgage History
| Date | Status | Borrower | Loan Amount |
|---|---|---|---|
| Open | Hernandez Wilfredo | $158,000 | |
| Closed | Hernandez Wilfredo | $151,900 | |
| Previous Owner | Hernandez Wilfredo | $119,000 | |
| Previous Owner | Hernandez Wilfredo | $124,200 |
Source: Public Records
Tax History Compared to Growth
Tax History
| Year | Tax Paid | Tax Assessment Tax Assessment Total Assessment is a certain percentage of the fair market value that is determined by local assessors to be the total taxable value of land and additions on the property. | Land | Improvement |
|---|---|---|---|---|
| 2025 | $5,252 | $433,700 | $144,400 | $289,300 |
| 2024 | $5,059 | $420,900 | $144,400 | $276,500 |
| 2023 | $4,701 | $362,200 | $109,300 | $252,900 |
| 2022 | $4,394 | $314,500 | $99,300 | $215,200 |
| 2021 | $4,354 | $300,300 | $92,800 | $207,500 |
| 2020 | $4,242 | $280,000 | $89,100 | $190,900 |
| 2019 | $3,916 | $252,000 | $82,900 | $169,100 |
| 2018 | $3,800 | $236,600 | $82,900 | $153,700 |
| 2017 | $3,502 | $217,500 | $82,900 | $134,600 |
| 2016 | $3,616 | $208,300 | $79,100 | $129,200 |
| 2015 | $3,559 | $196,100 | $79,100 | $117,000 |
| 2014 | $3,167 | $174,700 | $79,100 | $95,600 |
Source: Public Records
Map
Nearby Homes