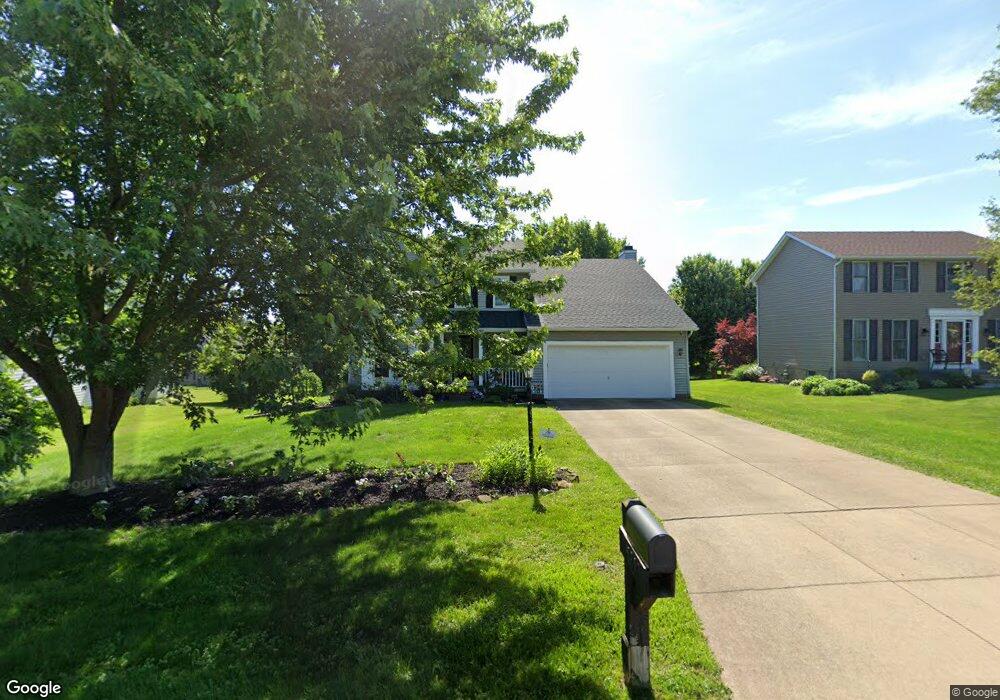
589 Redfield Ln Copley, OH 44321
Estimated Value: $385,000 - $445,000
4
Beds
3
Baths
1,884
Sq Ft
$221/Sq Ft
Est. Value
About This Home
This home is located at 589 Redfield Ln, Copley, OH 44321 and is currently estimated at $415,687, approximately $220 per square foot. 589 Redfield Ln is a home located in Summit County with nearby schools including Spring Garden Waldorf School and Fairlawn Lutheran School.
Ownership History
Date
Name
Owned For
Owner Type
Purchase Details
Closed on
Apr 1, 2016
Sold by
Marlborogh Michael F and Marlborogh Mary T
Bought by
Marlborogh Mary T
Current Estimated Value
Home Financials for this Owner
Home Financials are based on the most recent Mortgage that was taken out on this home.
Original Mortgage
$143,000
Outstanding Balance
$113,268
Interest Rate
3.59%
Mortgage Type
New Conventional
Estimated Equity
$302,419
Purchase Details
Closed on
Apr 16, 2004
Sold by
Kapitanchuk Guillermo R and Sanchez Emilee
Bought by
Marlborough Michael F and Marlborough Mary T
Home Financials for this Owner
Home Financials are based on the most recent Mortgage that was taken out on this home.
Original Mortgage
$187,900
Interest Rate
4.75%
Mortgage Type
Purchase Money Mortgage
Purchase Details
Closed on
Dec 16, 1999
Sold by
Wagler Homes Inc
Bought by
Kapitanchuk Guillermo R
Home Financials for this Owner
Home Financials are based on the most recent Mortgage that was taken out on this home.
Original Mortgage
$176,850
Interest Rate
8.37%
Create a Home Valuation Report for This Property
The Home Valuation Report is an in-depth analysis detailing your home's value as well as a comparison with similar homes in the area
Home Values in the Area
Average Home Value in this Area
Purchase History
| Date | Buyer | Sale Price | Title Company |
|---|---|---|---|
| Marlborogh Mary T | $36,500 | None Available | |
| Marlborough Michael F | $234,900 | Portgage Lawyers Title | |
| Kapitanchuk Guillermo R | $201,850 | Midland Commerce Group |
Source: Public Records
Mortgage History
| Date | Status | Borrower | Loan Amount |
|---|---|---|---|
| Open | Marlborogh Mary T | $143,000 | |
| Closed | Marlborough Michael F | $187,900 | |
| Closed | Kapitanchuk Guillermo R | $176,850 |
Source: Public Records
Tax History Compared to Growth
Tax History
| Year | Tax Paid | Tax Assessment Tax Assessment Total Assessment is a certain percentage of the fair market value that is determined by local assessors to be the total taxable value of land and additions on the property. | Land | Improvement |
|---|---|---|---|---|
| 2025 | $6,130 | $107,181 | $25,942 | $81,239 |
| 2024 | $6,130 | $107,181 | $25,942 | $81,239 |
| 2023 | $6,130 | $107,181 | $25,942 | $81,239 |
| 2022 | $5,715 | $84,462 | $20,426 | $64,036 |
| 2021 | $5,136 | $84,462 | $20,426 | $64,036 |
| 2020 | $5,016 | $84,470 | $20,430 | $64,040 |
| 2019 | $4,785 | $72,590 | $20,430 | $52,160 |
| 2018 | $4,633 | $72,590 | $20,430 | $52,160 |
| 2017 | $4,443 | $72,590 | $20,430 | $52,160 |
| 2016 | $4,392 | $67,950 | $20,430 | $47,520 |
| 2015 | $4,443 | $67,950 | $20,430 | $47,520 |
| 2014 | $4,413 | $67,950 | $20,430 | $47,520 |
| 2013 | $4,306 | $67,940 | $19,020 | $48,920 |
Source: Public Records
Map
Nearby Homes
- 4180 Castle Ridge
- 3982 Palace Way
- 4212 Devonshire Ct
- 425 S Hametown Rd
- 4038 Gardiner Run
- 991 Croghan Way
- 522 Robinwood Ln Unit I
- 3974 Gardiner Run
- 389 Caleb Dr
- 3888 Gardiner Run
- 4388 Wedgewood Dr
- 4417 Wyndham Way
- 521 Weston Ct
- 4467 Briarwood Dr
- 892 Clearwood Rd
- 498 Weston Ct
- 4496 Millbrook Way
- 483 Rothrock Rd
- 4581 Rockridge Way
- 3800 Rosemont Blvd Unit 111B
- 597 Redfield Ln
- 581 Redfield Ln
- 573 Redfield Ln
- 605 Redfield Ln
- 4220 Castle Ridge
- 4204 Castle Ridge
- 4228 Castle Ridge
- 4236 Castle Ridge
- 4127 Westbourne Blvd
- 4128 Westbourne Blvd
- 4196 Castle Ridge
- 565 Redfield Ln
- 4244 Castle Ridge
- 4188 Castle Ridge
- 4135 Westbourne Blvd
- 566 Redfield Ln
- 4252 Castle Ridge
- 4138 Westbourne Blvd
- 555 Redfield Ln
- 608 Redfield Ln