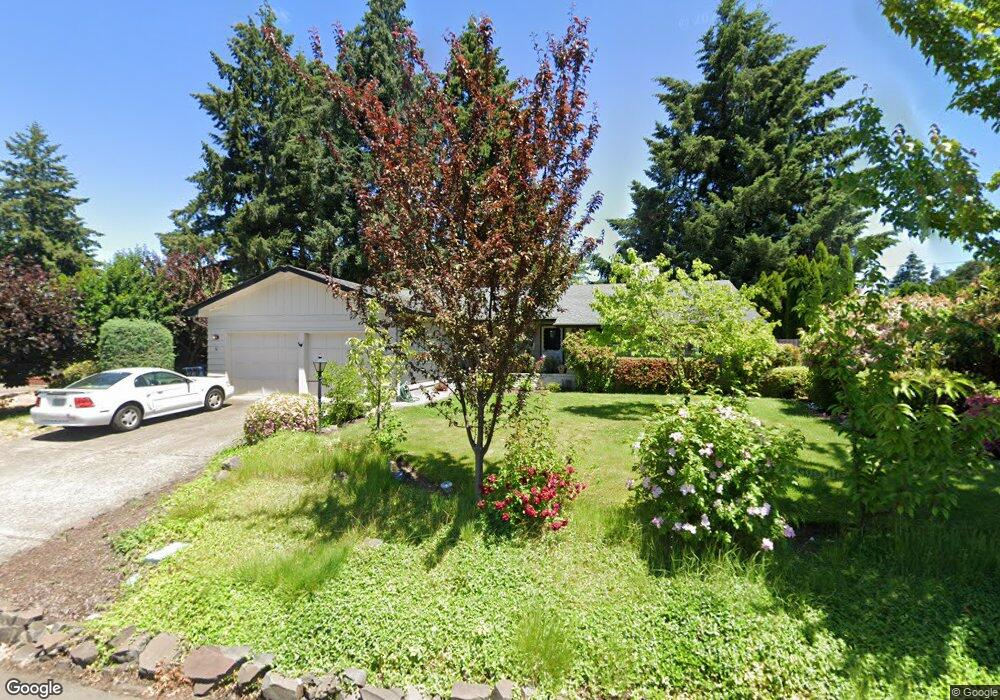
589 Roan Dr Eugene, OR 97401
Harlow NeighborhoodEstimated Value: $569,819 - $642,000
3
Beds
2
Baths
1,742
Sq Ft
$346/Sq Ft
Est. Value
About This Home
This home is located at 589 Roan Dr, Eugene, OR 97401 and is currently estimated at $603,455, approximately $346 per square foot. 589 Roan Dr is a home located in Lane County with nearby schools including Holt Elementary School, Monroe Middle School, and Sheldon High School.
Ownership History
Date
Name
Owned For
Owner Type
Purchase Details
Closed on
Feb 21, 2025
Sold by
Kline Kelly W
Bought by
Kelly W Kline Revocable Trust and Kline
Current Estimated Value
Purchase Details
Closed on
May 21, 2001
Sold by
Badkin Vincent L and Badkin Samantha J
Bought by
Kline Kelly W and Kline Paula R
Home Financials for this Owner
Home Financials are based on the most recent Mortgage that was taken out on this home.
Original Mortgage
$188,700
Interest Rate
7.06%
Mortgage Type
VA
Purchase Details
Closed on
Apr 6, 2000
Sold by
Allen Nancy B
Bought by
Badkin Vincent L and Badkin Samantha J
Home Financials for this Owner
Home Financials are based on the most recent Mortgage that was taken out on this home.
Original Mortgage
$150,000
Interest Rate
8.3%
Purchase Details
Closed on
Mar 31, 2000
Sold by
Bowker Donald R
Bought by
Allen Nancy B
Home Financials for this Owner
Home Financials are based on the most recent Mortgage that was taken out on this home.
Original Mortgage
$150,000
Interest Rate
8.3%
Create a Home Valuation Report for This Property
The Home Valuation Report is an in-depth analysis detailing your home's value as well as a comparison with similar homes in the area
Home Values in the Area
Average Home Value in this Area
Purchase History
| Date | Buyer | Sale Price | Title Company |
|---|---|---|---|
| Kelly W Kline Revocable Trust | -- | None Listed On Document | |
| Kline Kelly W | $185,000 | Western Pioneer Title Co | |
| Badkin Vincent L | -- | Fidelity National Title Co | |
| Allen Nancy B | $176,500 | Fidelity National Title Ins |
Source: Public Records
Mortgage History
| Date | Status | Borrower | Loan Amount |
|---|---|---|---|
| Previous Owner | Kline Kelly W | $188,700 | |
| Previous Owner | Allen Nancy B | $150,000 |
Source: Public Records
Tax History
| Year | Tax Paid | Tax Assessment Tax Assessment Total Assessment is a certain percentage of the fair market value that is determined by local assessors to be the total taxable value of land and additions on the property. | Land | Improvement |
|---|---|---|---|---|
| 2025 | $4,773 | $276,536 | -- | -- |
| 2024 | $4,714 | $268,482 | -- | -- |
| 2023 | $4,714 | $260,663 | -- | -- |
| 2022 | $4,416 | $253,071 | $0 | $0 |
| 2021 | $4,148 | $245,700 | $0 | $0 |
| 2020 | $4,162 | $238,544 | $0 | $0 |
| 2019 | $4,020 | $231,597 | $0 | $0 |
| 2018 | $3,784 | $218,303 | $0 | $0 |
| 2017 | $3,614 | $218,303 | $0 | $0 |
| 2016 | $3,492 | $211,945 | $0 | $0 |
| 2015 | $3,369 | $205,772 | $0 | $0 |
| 2014 | $3,718 | $199,779 | $0 | $0 |
Source: Public Records
Map
Nearby Homes
- 2994 Dapple Way
- 860 N van Duyn St
- 2872 Suffolk Ct
- 280 Regal Ct
- 2746 Harlow Rd
- 825 Waverly St
- 600 Cherry Dr Unit 8
- 3460 Oxbow Way
- 3579 Oxbow Way
- 1038 President St
- 2355 Pioneer Pike
- 347 Rustic Place Unit 14
- 446 Kodiak St
- 950 Coburg Rd
- 3025 Bailey Ln
- 1270 Calvin St
- 3700 Babcock Ln Unit 119
- 3700 Babcock Ln Unit 106
- 1271 Arcadia Dr
- 820 Lariat Dr
Your Personal Tour Guide
Ask me questions while you tour the home.