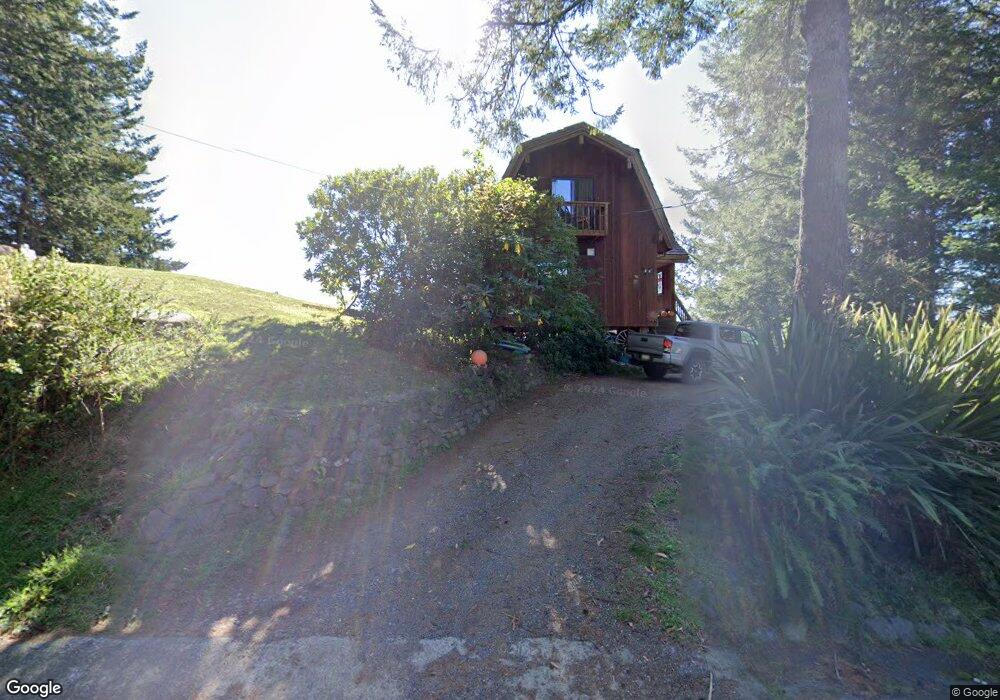
589 Spring Rd Whitethorn, CA 95589
Estimated Value: $254,177 - $468,000
Studio
--
Bath
--
Sq Ft
6,186
Sq Ft Lot
About This Home
This home is located at 589 Spring Rd, Whitethorn, CA 95589 and is currently estimated at $330,044. 589 Spring Rd is a home located in Humboldt County.
Ownership History
Date
Name
Owned For
Owner Type
Purchase Details
Closed on
Aug 21, 2014
Sold by
Dumas Mckenna Roy C and Dumas Mckenna Debra
Bought by
Johnston Joshua
Current Estimated Value
Home Financials for this Owner
Home Financials are based on the most recent Mortgage that was taken out on this home.
Original Mortgage
$110,000
Outstanding Balance
$83,875
Interest Rate
4.11%
Mortgage Type
Seller Take Back
Estimated Equity
$246,169
Purchase Details
Closed on
Nov 29, 2012
Sold by
Dumas Mckenna Roy C and Dumas Mckenna Debra
Bought by
Dumas Mckenna Roy C and Dumas Mckenna Debra
Purchase Details
Closed on
Jun 29, 2006
Sold by
Mckenna Roy C
Bought by
Mckenna Roy C and Dumas Debra A
Create a Home Valuation Report for This Property
The Home Valuation Report is an in-depth analysis detailing your home's value as well as a comparison with similar homes in the area
Home Values in the Area
Average Home Value in this Area
Purchase History
| Date | Buyer | Sale Price | Title Company |
|---|---|---|---|
| Johnston Joshua | $150,000 | Humboldt Title | |
| Dumas Mckenna Roy C | -- | None Available | |
| Mckenna Roy C | -- | None Available |
Source: Public Records
Mortgage History
| Date | Status | Borrower | Loan Amount |
|---|---|---|---|
| Open | Johnston Joshua | $110,000 |
Source: Public Records
Tax History
| Year | Tax Paid | Tax Assessment Tax Assessment Total Assessment is a certain percentage of the fair market value that is determined by local assessors to be the total taxable value of land and additions on the property. | Land | Improvement |
|---|---|---|---|---|
| 2025 | $2,221 | $180,270 | $60,089 | $120,181 |
| 2024 | $2,221 | $176,736 | $58,911 | $117,825 |
| 2023 | $2,229 | $173,271 | $57,756 | $115,515 |
| 2022 | $2,199 | $169,874 | $56,624 | $113,250 |
| 2021 | $2,125 | $166,544 | $55,514 | $111,030 |
| 2020 | $2,137 | $164,837 | $54,945 | $109,892 |
| 2019 | $2,090 | $161,606 | $53,868 | $107,738 |
| 2018 | $2,059 | $158,438 | $52,812 | $105,626 |
| 2017 | $1,925 | $155,332 | $51,777 | $103,555 |
| 2016 | $1,914 | $152,287 | $50,762 | $101,525 |
| 2015 | $1,906 | $150,000 | $50,000 | $100,000 |
| 2014 | $2,265 | $191,817 | $47,949 | $143,868 |
Source: Public Records
Map
Nearby Homes
Your Personal Tour Guide
Ask me questions while you tour the home.