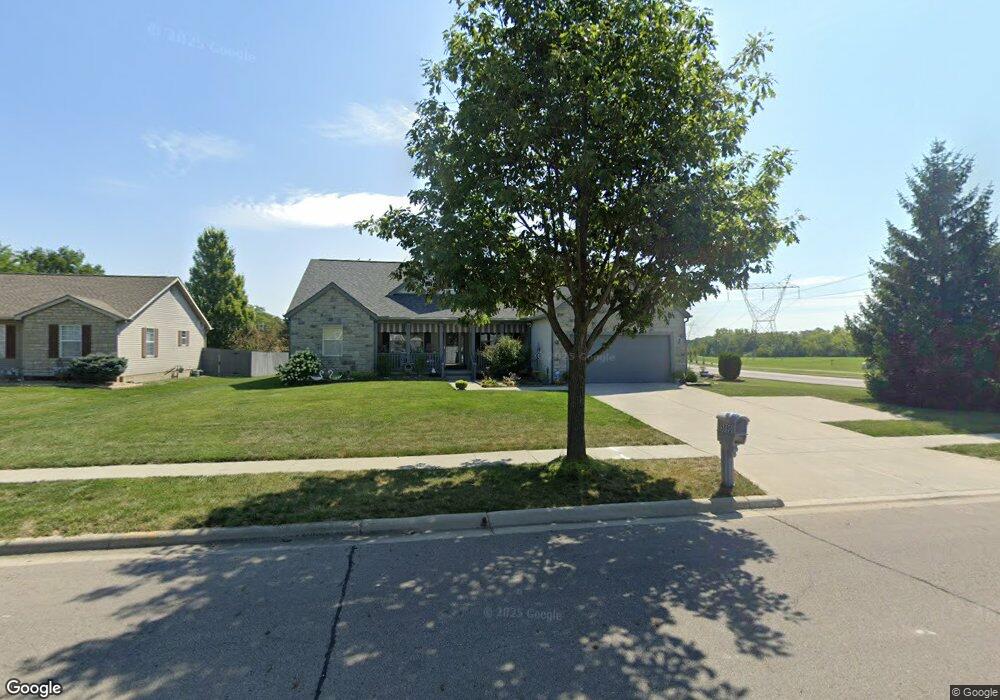
5890 Quail Run Dr Grove City, OH 43123
Estimated Value: $447,000 - $454,000
3
Beds
3
Baths
2,394
Sq Ft
$188/Sq Ft
Est. Value
About This Home
This home is located at 5890 Quail Run Dr, Grove City, OH 43123 and is currently estimated at $450,498, approximately $188 per square foot. 5890 Quail Run Dr is a home located in Franklin County with nearby schools including Buckeye Woods Elementary School, Hayes Intermediate School, and Jackson Middle School.
Ownership History
Date
Name
Owned For
Owner Type
Purchase Details
Closed on
Mar 24, 2022
Sold by
Wills Romma M
Bought by
Darst Iris L
Current Estimated Value
Purchase Details
Closed on
Mar 18, 2022
Sold by
Wills Romma M
Bought by
Darst Iris L
Purchase Details
Closed on
Aug 24, 2001
Sold by
3 Pillar Construction Co Ltd
Bought by
Wills Gary R and Wills Romma M
Purchase Details
Closed on
Jun 14, 2000
Sold by
White Oak Communities Inc
Bought by
3 Pillar Construction Company Ltd
Home Financials for this Owner
Home Financials are based on the most recent Mortgage that was taken out on this home.
Original Mortgage
$23,120
Interest Rate
8.66%
Mortgage Type
Purchase Money Mortgage
Create a Home Valuation Report for This Property
The Home Valuation Report is an in-depth analysis detailing your home's value as well as a comparison with similar homes in the area
Home Values in the Area
Average Home Value in this Area
Purchase History
| Date | Buyer | Sale Price | Title Company |
|---|---|---|---|
| Darst Iris L | $296,000 | Hendrix Robert S | |
| Darst Iris L | $296,000 | Hendrix Robert S | |
| Wills Gary R | $208,400 | -- | |
| 3 Pillar Construction Company Ltd | $28,900 | Assurance Title Agency Of Oh |
Source: Public Records
Mortgage History
| Date | Status | Borrower | Loan Amount |
|---|---|---|---|
| Previous Owner | 3 Pillar Construction Company Ltd | $23,120 |
Source: Public Records
Tax History Compared to Growth
Tax History
| Year | Tax Paid | Tax Assessment Tax Assessment Total Assessment is a certain percentage of the fair market value that is determined by local assessors to be the total taxable value of land and additions on the property. | Land | Improvement |
|---|---|---|---|---|
| 2024 | $6,117 | $134,510 | $37,450 | $97,060 |
| 2023 | $6,030 | $134,505 | $37,450 | $97,055 |
| 2022 | $8,752 | $103,810 | $24,500 | $79,310 |
| 2021 | $5,909 | $103,810 | $24,500 | $79,310 |
| 2020 | $5,890 | $103,810 | $24,500 | $79,310 |
| 2019 | $5,197 | $86,560 | $20,410 | $66,150 |
| 2018 | $4,970 | $88,840 | $20,410 | $68,430 |
| 2017 | $5,309 | $88,840 | $20,410 | $68,430 |
| 2016 | $4,610 | $72,350 | $16,980 | $55,370 |
| 2015 | $4,611 | $72,350 | $16,980 | $55,370 |
| 2014 | $4,614 | $72,350 | $16,980 | $55,370 |
| 2013 | $2,060 | $68,915 | $16,170 | $52,745 |
Source: Public Records
Map
Nearby Homes
- 2310 Ravine Woods Dr Unit 22
- 2336 Willowside Ln Unit 2336
- 2504 Landings Way Unit 52504
- 5796 Ravine Creek Dr
- 2383 Birch Bark Trail
- 5941 Landings Pond Place
- 2609 Landings Way Unit 29-D
- 2384 Birch Bark Trail
- 5870 Crooked Creek Blvd Unit 5870
- 2382 Clover Blossom Ct
- 5636 Cloverleaf Ct
- 2051 Borror Rd
- 2305 Spring Cress Ave
- 5560 Blue Star Dr
- 0 London Groveport Rd Unit 225019366
- 2335 Fernwood Ave
- 5428 Hoover Rd
- 5793 Daffodil Ct
- 5455 Lilac Ave
- 5712 Buckeye Pkwy
- 5878 Quail Run Dr
- 2306 Ravine Woods Dr
- 2314 Ravine Woods Dr
- 2292 Ravine Woods Dr
- 5866 Quail Run Dr
- 5889 Quail Run Dr
- 2284 Ravine Woods Dr
- 2296 Ravine Woods Dr
- 2310 Ravine Woods Dr Unit 2310
- 2302 Ravine Woods Dr
- 2302 Ravine Woods Dr Unit 22-230
- 0 Quail Creek Blvd Unit 158
- 2288 Ravine Woods Dr
- 5873 Quail Run Dr
- 5854 Quail Run Dr
- 2274 Ravine Woods Dr
- 5861 Quail Run Dr
- 2278 Ravine Woods Dr
- 2266 Ravine Woods Dr
- 5844 Quail Run Dr