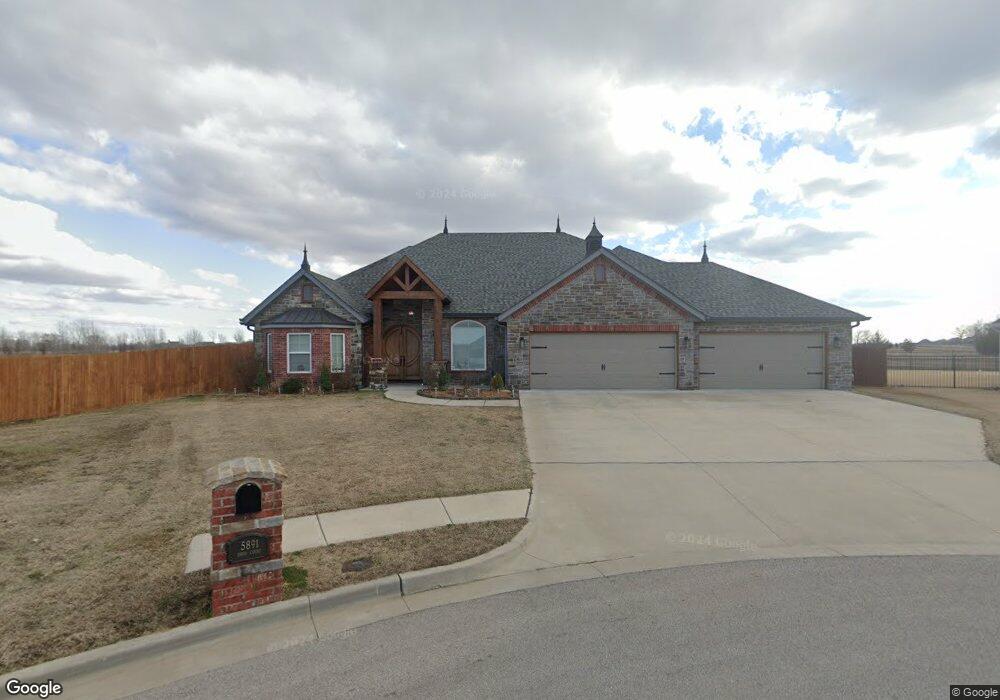
5891 Ohio Ct Bartlesville, OK 74006
Estimated Value: $397,000 - $544,000
4
Beds
2
Baths
2,969
Sq Ft
$153/Sq Ft
Est. Value
About This Home
This home is located at 5891 Ohio Ct, Bartlesville, OK 74006 and is currently estimated at $454,318, approximately $153 per square foot. 5891 Ohio Ct is a home with nearby schools including Woodrow Wilson Elementary School, Madison Middle School, and Bartlesville High School.
Ownership History
Date
Name
Owned For
Owner Type
Purchase Details
Closed on
Dec 14, 2023
Sold by
Anderson Laura and Anderson Terry
Bought by
Anderson Laura
Current Estimated Value
Purchase Details
Closed on
Oct 23, 2020
Sold by
Taylor Kimrey Llc
Bought by
Anderson Lance and Anderson Laura
Purchase Details
Closed on
Jul 14, 2017
Sold by
Brent Taylor Homes Inc
Bought by
Anderson Terry L and Willis Laura M
Home Financials for this Owner
Home Financials are based on the most recent Mortgage that was taken out on this home.
Original Mortgage
$319,700
Interest Rate
3.94%
Mortgage Type
New Conventional
Purchase Details
Closed on
Jul 12, 2017
Sold by
Taylor Kimrey Llc
Bought by
Brent Taylor Homes Inc
Home Financials for this Owner
Home Financials are based on the most recent Mortgage that was taken out on this home.
Original Mortgage
$319,700
Interest Rate
3.94%
Mortgage Type
New Conventional
Create a Home Valuation Report for This Property
The Home Valuation Report is an in-depth analysis detailing your home's value as well as a comparison with similar homes in the area
Home Values in the Area
Average Home Value in this Area
Purchase History
| Date | Buyer | Sale Price | Title Company |
|---|---|---|---|
| Anderson Laura | -- | None Listed On Document | |
| Anderson Lance | $36,000 | None Available | |
| Anderson Terry L | $403,000 | None Available | |
| Brent Taylor Homes Inc | -- | None Available |
Source: Public Records
Mortgage History
| Date | Status | Borrower | Loan Amount |
|---|---|---|---|
| Previous Owner | Anderson Terry L | $319,700 |
Source: Public Records
Tax History Compared to Growth
Tax History
| Year | Tax Paid | Tax Assessment Tax Assessment Total Assessment is a certain percentage of the fair market value that is determined by local assessors to be the total taxable value of land and additions on the property. | Land | Improvement |
|---|---|---|---|---|
| 2025 | $5,779 | $50,532 | $7,200 | $43,332 |
| 2024 | $5,779 | $48,126 | $7,200 | $40,926 |
| 2023 | $5,779 | $48,126 | $7,200 | $40,926 |
| 2022 | $5,765 | $48,126 | $7,200 | $40,926 |
| 2021 | $5,653 | $48,126 | $7,200 | $40,926 |
| 2020 | $5,778 | $48,126 | $7,200 | $40,926 |
| 2019 | $5,840 | $48,612 | $8,400 | $40,212 |
| 2018 | $5,811 | $48,612 | $8,400 | $40,212 |
| 2017 | $5,886 | $48,120 | $8,400 | $39,720 |
| 2016 | $3 | $22 | $22 | $0 |
Source: Public Records
Map
Nearby Homes
- 304 Barley Hill Rd
- 174 Parkhill Place
- 5916 Coldspring Ln
- 5822 Coldspring Ln
- 5908 Coldspring Ln
- 5822 Brandon Ct
- 6220 Sawgrass Dr
- TBD NE Madison Blvd
- 000 NE Madison Blvd
- 200 SE Quail Ridge Loop
- 208 NE Spruce Ave
- 309 N Spruce Ave
- 605 N Spruce Ave
- 639 NE Bison Rd
- 420 N Cummings Ave
- 348 N Fenway Ave
- 275 Turkey Creek Rd
- 624 NE Fenway Ave
- 440 NE Elmhurst Ave
- 325 Turkey Creek Rd
- 5887 Ohio Ct
- 5883 Ohio Ct
- 330 Barley Hill Rd
- 330 Barley Hill Rd
- 5894 Ohio St
- 5898 Ohio St
- 5808 Ohio St
- 5804 Ohio St
- 326 Parkhill Ln
- 322 Parkhill Ln
- 316 Parkhill Ln
- 334 Parkhill Ln
- 314 Parkhill Ln
- 336 Parkhill Ln
- 310 Parkhill Ln
- 321 Parkhill Ln
- 317 Parkhill Ln
- 437 N Parkhill Loop
- 323 Parkhill Ln
- 313 Parkhill Ln