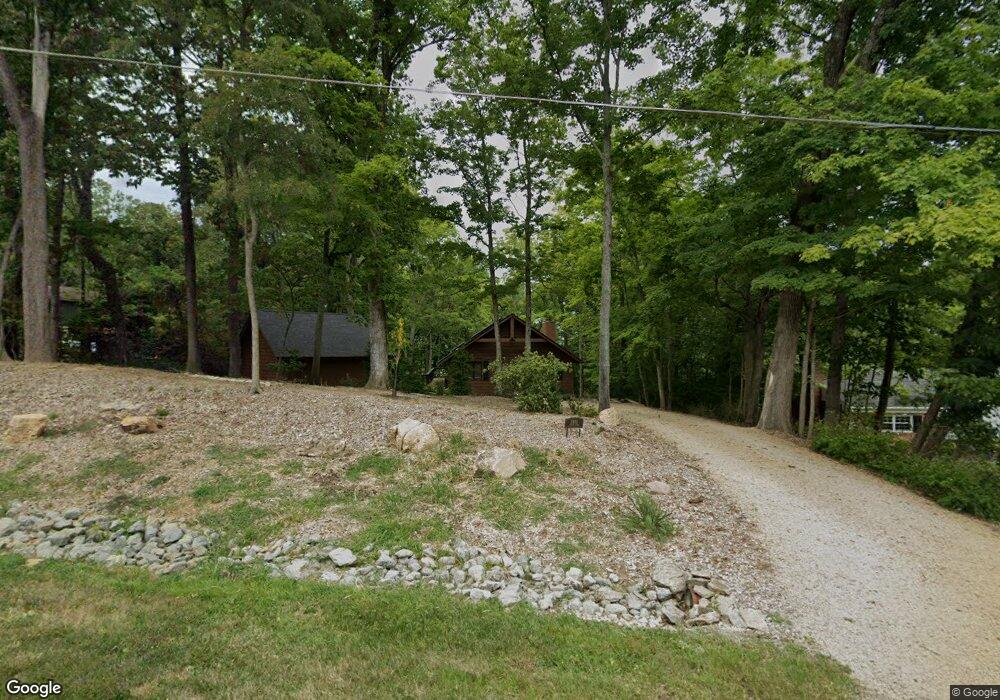
5893 Thorny Ridge Milford, OH 45150
Estimated Value: $336,000 - $561,000
3
Beds
2
Baths
1,380
Sq Ft
$336/Sq Ft
Est. Value
About This Home
This home is located at 5893 Thorny Ridge, Milford, OH 45150 and is currently estimated at $464,263, approximately $336 per square foot. 5893 Thorny Ridge is a home located in Clermont County with nearby schools including Milford Senior High School, St. Andrew - St. Elizabeth Ann Seton School, and St. Mark's Lutheran School.
Ownership History
Date
Name
Owned For
Owner Type
Purchase Details
Closed on
Feb 19, 2021
Sold by
W & D Wolfe Investment Properties Llc
Bought by
Cochran Dale and Cochran Jane
Current Estimated Value
Purchase Details
Closed on
Apr 15, 2020
Sold by
Black Charles J and Nationstar Mortgage Llc
Bought by
W & D Wolfe Investment Properties Llc
Purchase Details
Closed on
Jun 10, 2005
Sold by
Cahill Dianne E
Bought by
Black Charles J
Home Financials for this Owner
Home Financials are based on the most recent Mortgage that was taken out on this home.
Original Mortgage
$140,000
Interest Rate
5.75%
Mortgage Type
Fannie Mae Freddie Mac
Purchase Details
Closed on
May 22, 1997
Sold by
Morgan James M
Bought by
Cahill Charles J Black and Cahill Diane E
Home Financials for this Owner
Home Financials are based on the most recent Mortgage that was taken out on this home.
Original Mortgage
$123,300
Interest Rate
7.88%
Mortgage Type
New Conventional
Create a Home Valuation Report for This Property
The Home Valuation Report is an in-depth analysis detailing your home's value as well as a comparison with similar homes in the area
Home Values in the Area
Average Home Value in this Area
Purchase History
| Date | Buyer | Sale Price | Title Company |
|---|---|---|---|
| Cochran Dale | $400,000 | None Available | |
| Cochran Dale | $400,000 | Tudor Gregory S | |
| W & D Wolfe Investment Properties Llc | $131,000 | None Available | |
| Black Charles J | $175,000 | -- | |
| Cahill Charles J Black | $145,000 | -- |
Source: Public Records
Mortgage History
| Date | Status | Borrower | Loan Amount |
|---|---|---|---|
| Previous Owner | Black Charles J | $140,000 | |
| Previous Owner | Cahill Charles J Black | $123,300 | |
| Closed | Black Charles J | $17,500 |
Source: Public Records
Tax History Compared to Growth
Tax History
| Year | Tax Paid | Tax Assessment Tax Assessment Total Assessment is a certain percentage of the fair market value that is determined by local assessors to be the total taxable value of land and additions on the property. | Land | Improvement |
|---|---|---|---|---|
| 2024 | $3,542 | $77,740 | $17,150 | $60,590 |
| 2023 | $3,579 | $77,740 | $17,150 | $60,590 |
| 2022 | $3,752 | $62,060 | $13,650 | $48,410 |
| 2021 | $3,851 | $62,060 | $13,650 | $48,410 |
| 2020 | $3,600 | $62,060 | $13,650 | $48,410 |
| 2019 | $3,874 | $63,390 | $13,550 | $49,840 |
| 2018 | $3,875 | $63,390 | $13,550 | $49,840 |
| 2017 | $3,521 | $63,390 | $13,550 | $49,840 |
| 2016 | $3,521 | $52,400 | $11,200 | $41,200 |
| 2015 | $3,285 | $52,400 | $11,200 | $41,200 |
| 2014 | $3,285 | $52,400 | $11,200 | $41,200 |
| 2013 | $3,122 | $48,300 | $10,500 | $37,800 |
Source: Public Records
Map
Nearby Homes
- 772 Price Knoll Ln
- 5880 Stonebridge Cir
- 221 Miami Lakes Dr
- 5884 Stonebridge Cir
- 5 White Water Way
- 5763 Price Rd
- 5612 Flagstone Way
- 732 St Rt 28
- 18 Big Oak Ln
- 957 Tarragon Ln
- 5897 Cook Rd
- 5633 Happy Hollow Rd
- 12 Valley View Cir
- 826 Ohio 131
- 977 Newberry Ave
- 1010 Newberry Ave
- 764 Forest Ave
- 250 Postoak Ln
- 1524 Summerview Ln
- 1514 Summerview Ln
- 5893 Thorny Ridge Ln
- 5897 Thorny Ridge
- 5889 Thorny Ridge
- 5889 Thorny Ridge Ln
- 709 Pine Ridge Rd
- 5887 Thorny Ridge
- 706 Maple Ridge Rd
- 710 Pine Ridge Rd
- 5901 Thorny Ridge Ln
- 5901 Thorny Ridge
- 710 Maple Ridge Rd
- 713 Pine Ridge Rd
- 713 Shady Hollow Ln
- 714 Maple Ridge Rd
- 705 Maple Ridge Rd
- 705 Maple Ridge Rd
- 717 Pine Ridge Rd
- 718 Pine Ridge Rd
- 707 Maple Ridge Rd
- 5905 Thorny Ridge