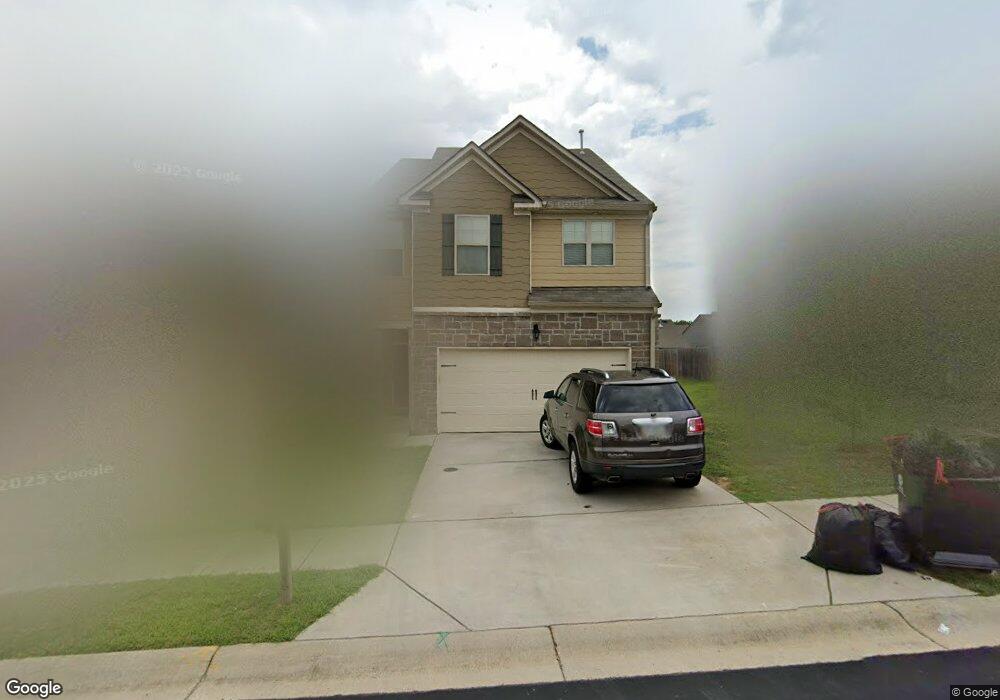
5895 San Gabriel Ln Unit 164 Atlanta, GA 30349
Estimated Value: $270,000 - $282,000
4
Beds
3
Baths
1,976
Sq Ft
$140/Sq Ft
Est. Value
About This Home
This home is located at 5895 San Gabriel Ln Unit 164, Atlanta, GA 30349 and is currently estimated at $276,353, approximately $139 per square foot. 5895 San Gabriel Ln Unit 164 is a home located in Clayton County with nearby schools including Northcutt Elementary School, North Clayton Middle School, and North Clayton High School.
Ownership History
Date
Name
Owned For
Owner Type
Purchase Details
Closed on
May 22, 2015
Sold by
Wilson Parker Homes Of Crenshaw Park Inc
Bought by
Fall Rassoul
Current Estimated Value
Home Financials for this Owner
Home Financials are based on the most recent Mortgage that was taken out on this home.
Original Mortgage
$152,352
Outstanding Balance
$119,743
Interest Rate
4.25%
Mortgage Type
FHA
Estimated Equity
$156,610
Purchase Details
Closed on
Mar 17, 2015
Sold by
Atlas Of Crenshaw Park Inc
Bought by
Wilson Parker Homes Of Crensha
Home Financials for this Owner
Home Financials are based on the most recent Mortgage that was taken out on this home.
Original Mortgage
$690,000
Interest Rate
3.87%
Mortgage Type
New Conventional
Purchase Details
Closed on
May 8, 2013
Sold by
Atlas Ga Xx Reo Llc
Bought by
Atlas Of Crenshaw Park Llc
Purchase Details
Closed on
Nov 6, 2012
Sold by
Legacy Investment Grp Llc
Bought by
Atlas Ga Xx Reo Llc
Create a Home Valuation Report for This Property
The Home Valuation Report is an in-depth analysis detailing your home's value as well as a comparison with similar homes in the area
Home Values in the Area
Average Home Value in this Area
Purchase History
| Date | Buyer | Sale Price | Title Company |
|---|---|---|---|
| Fall Rassoul | $155,200 | -- | |
| Wilson Parker Homes Of Crensha | $60,000 | -- | |
| Atlas Of Crenshaw Park Llc | -- | -- | |
| Atlas Ga Xx Reo Llc | -- | -- |
Source: Public Records
Mortgage History
| Date | Status | Borrower | Loan Amount |
|---|---|---|---|
| Open | Fall Rassoul | $152,352 | |
| Closed | Fall Rassoul | $5,000 | |
| Previous Owner | Wilson Parker Homes Of Crensha | $690,000 |
Source: Public Records
Tax History Compared to Growth
Tax History
| Year | Tax Paid | Tax Assessment Tax Assessment Total Assessment is a certain percentage of the fair market value that is determined by local assessors to be the total taxable value of land and additions on the property. | Land | Improvement |
|---|---|---|---|---|
| 2024 | $4,471 | $123,640 | $9,600 | $114,040 |
| 2023 | $3,341 | $119,480 | $9,600 | $109,880 |
| 2022 | $3,266 | $92,240 | $9,600 | $82,640 |
| 2021 | $2,629 | $75,600 | $9,600 | $66,000 |
| 2020 | $2,376 | $68,448 | $9,600 | $58,848 |
| 2019 | $2,406 | $68,320 | $5,600 | $62,720 |
| 2018 | $2,619 | $73,576 | $5,600 | $67,976 |
| 2017 | $2,218 | $63,572 | $5,600 | $57,972 |
| 2016 | $2,157 | $62,080 | $5,600 | $56,480 |
| 2015 | $262 | $0 | $0 | $0 |
| 2014 | $213 | $4,400 | $4,400 | $0 |
Source: Public Records
Map
Nearby Homes
- 5854 El Segundo Way
- 5950 Milligan Ct
- 1969 Banks Way
- 1947 Eshelman Ct
- 6105 Camden Forrest Ct
- 1125 Knight Ct
- 6073 Camden Forrest Dr
- 6076 Camden Forrest Dr
- 5937 Yellowood Ct
- 6080 Camden Forrest Cove
- 5768 Grande River Rd
- 1618 Blossom Dr
- 1991 Flat Shoals Rd
- 1711 Austin Dr
- 6105 E Fayetteville Dr
- 1853 Broad River Rd
- 1857 Rockford Ct
- 5895 San Gabriel Ln
- 5897 San Gabriel Ln Unit 165
- 5897 San Gabriel Ln
- 5891 San Gabriel Ln Unit 163
- 5891 San Gabriel Ln
- 5899 San Gabriel Ln Unit 166
- 5899 San Gabriel Ln
- 5889 San Gabriel Ln Unit 162
- 5889 San Gabriel Ln
- 5890 El Segundo Way Unit 127
- 5890 El Segundo Way
- 5901 San Gabriel Ln Unit 167
- 5901 San Gabriel Ln
- 5892 El Segundo Way Unit 126
- 5892 El Segundo Way
- 5886 El Segundo Way Unit 128
- 5886 El Segundo Way
- 5887 San Gabriel Ln Unit 161
- 5887 San Gabriel Ln
- 5894 El Segundo Way Unit 125