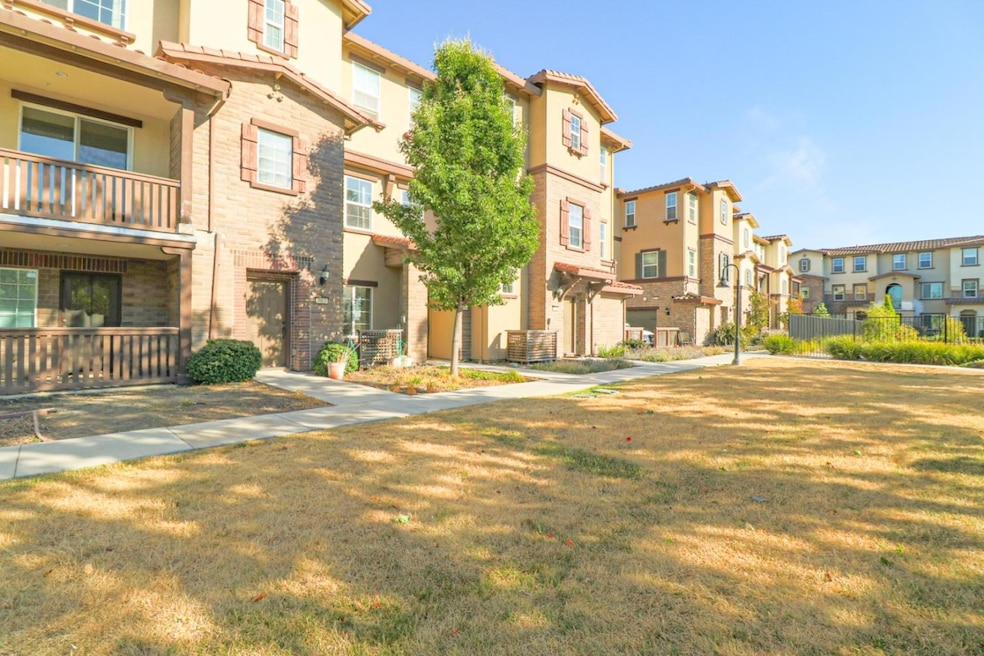
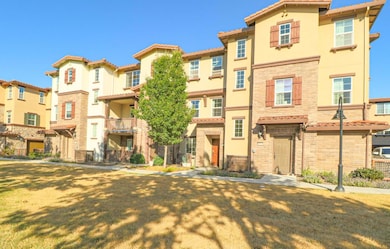
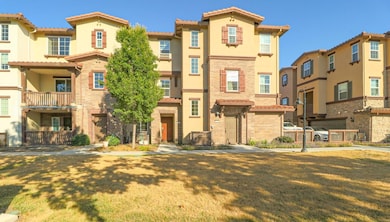
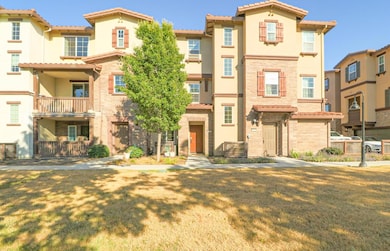
5898 Via Lugano Fremont, CA 94555
Ardenwood NeighborhoodHighlights
- Eat-In Kitchen
- Forced Air Heating and Cooling System
- Separate Family Room
- Warwick Elementary School Rated A
About This Home
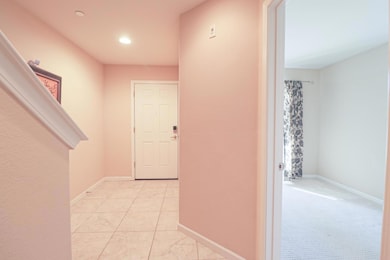
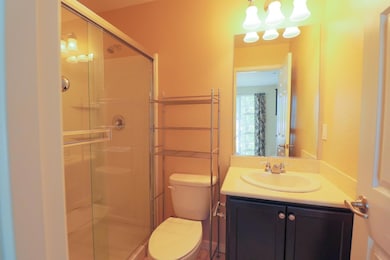
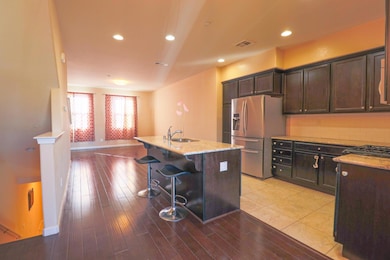
Welcome to this beautifully maintained 3-bedroom, 3.5-bathroom rental located in one of Fremont's most sought-after neighborhoods the Ardenwood community. This home offers the perfect blend of comfort, convenience, and modern living. Enjoy a bright, open-concept layout featuring a spacious family room and dining area, ideal for relaxing or entertaining. The gourmet kitchen is equipped with stainless steel appliances, granite countertops, and ample cabinet space for all your cooking needs. Each bedroom is generously sized, providing comfort and privacy for every member of the household. Located within the highly rated Fremont School District, residents benefit from nearby award-winning schools including Ardenwood Elementary, Thornton Middle, and American High School. Conveniently positioned near major Silicon Valley employers, parks, shopping, and dining, this home offers easy access to everything the Bay Area has to offer. Experience the perfect combination of community, location, and lifestyle
Townhouse Details
Home Type
- Townhome
Est. Annual Taxes
- $8,370
Year Built
- 2012
Interior Spaces
- 1,617 Sq Ft Home
- Separate Family Room
- Eat-In Kitchen
Bedrooms and Bathrooms
- 3 Bedrooms
Utilities
- Forced Air Heating and Cooling System
Listing and Financial Details
- Security Deposit $4,098
- Property Available on 11/10/25
- 12-Month Minimum Lease Term
Map
Source: MLSListings
MLS Number: ML82026115
APN: 543-0471-228-00
Disclaimer: Certain information contained herein is derived from information provided by parties other than Homes.com. All information provided is deemed reliable, but is not guaranteed to be accurate and should be independently verified.
![]() Property Information © 2025 MLSListings Inc. All rights reserved. Listing information is deemed reliable but not guaranteed. Certain information contained herein is derived from information which is the licensed property of, and copyrighted by, MLSListings Inc. The viewer acknowledges ownership and validity of its copyright. Information provided is for personal, non-commercial use by a viewer with a bona fide interest in the purchase or sale of real estate of the type being offered via this website or other electronic means. The viewer is prohibited from copying, redistributing or retransmitting any of the data or information provided by MLSListing, Inc.
Property Information © 2025 MLSListings Inc. All rights reserved. Listing information is deemed reliable but not guaranteed. Certain information contained herein is derived from information which is the licensed property of, and copyrighted by, MLSListings Inc. The viewer acknowledges ownership and validity of its copyright. Information provided is for personal, non-commercial use by a viewer with a bona fide interest in the purchase or sale of real estate of the type being offered via this website or other electronic means. The viewer is prohibited from copying, redistributing or retransmitting any of the data or information provided by MLSListing, Inc.
- 34192 Firenze Terrace
- 5621 Via Lugano
- 34198 Tony Terrace
- 6004 Pisa Terrace Unit 119
- 5301 Shamrock Common
- 33064 Compton Ct
- 5308 Tacoma Common
- 5220 Fairbanks Common
- 4942 Rocklin Dr
- 34648 Musk Terrace
- 32945 Regents Blvd
- 5060 Anaheim Loop
- 34565 Pueblo Terrace
- 4744 Touchstone Terrace
- 34607 Pueblo Terrace
- 34627 Pueblo Terrace
- 34102 Zaner Way
- 4512 Macbeth Ave
- 34768 Swain Common
- 4480 Norocco Cir
- 5962 Lugano Viaduct
- 5811 Via Lugano
- 5016 Paseo Padre Pkwy
- 4977 Conway Terrace
- 34736 Tuxedo Common
- 34612 Pueblo Terrace Unit Summerfield Ardenwood Fre
- 33710 Shylock Dr
- 34320 Chester Ct
- 35655 Haley St
- 34050 Westchester Terrace
- 34500 Fremont Blvd
- 5016 Wembley Ct
- 4616 Rochelle Dr
- 34077 Paseo Padre Pkwy
- 4158 Glenwood Terrace Unit 3
- 32445 Lake Barlee Ln
- 3012 Wolsey Place
- 31755 Alvarado Blvd
- 35995 Fremont Blvd
- 3750 Tamayo St
