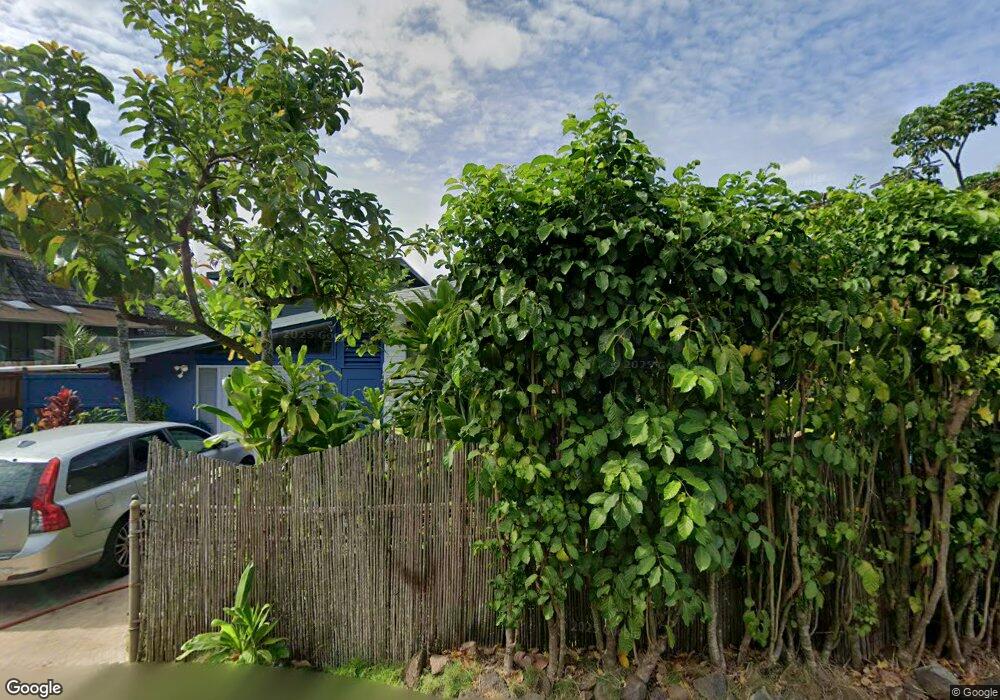
59-209 Ke Nui Rd Unit D Haleiwa, HI 96712
Estimated Value: $5,051,000 - $7,483,000
4
Beds
6
Baths
3,689
Sq Ft
$1,598/Sq Ft
Est. Value
About This Home
This home is located at 59-209 Ke Nui Rd Unit D, Haleiwa, HI 96712 and is currently estimated at $5,894,607, approximately $1,597 per square foot. 59-209 Ke Nui Rd Unit D is a home located in Honolulu County with nearby schools including Sunset Beach Elementary School and Kahuku High & Intermediate School.
Ownership History
Date
Name
Owned For
Owner Type
Purchase Details
Closed on
Jan 22, 2015
Sold by
Bark Andrew George and Bark Megan Kelly
Bought by
Bark Family Trust
Current Estimated Value
Purchase Details
Closed on
Apr 2, 2012
Sold by
Preisendorfer Russell W and Preisendorfer Angela C
Bought by
Bark Andrew George and Bark Megan Kelly
Purchase Details
Closed on
Jul 14, 2008
Sold by
Maertz Hatsumi and Maertz Allen Takichi
Bought by
Preisendorfer Russell W and Preisendorfer Angela C
Purchase Details
Closed on
Oct 17, 1996
Sold by
Maertz Warburton August and Maertz Hatsumi
Bought by
Maertz Allen Takichi
Purchase Details
Closed on
Aug 15, 1995
Sold by
Maertz Warburton August and Maertz Hatsumi
Bought by
Vitello Lauren
Purchase Details
Closed on
Oct 6, 1994
Sold by
Maertz Warburton August and Maertz Hatsumi
Bought by
Maertz Allen Takichi and Vitello Lauren
Create a Home Valuation Report for This Property
The Home Valuation Report is an in-depth analysis detailing your home's value as well as a comparison with similar homes in the area
Home Values in the Area
Average Home Value in this Area
Purchase History
| Date | Buyer | Sale Price | Title Company |
|---|---|---|---|
| Bark Family Trust | -- | None Available | |
| Bark Family Trust | -- | None Available | |
| Bark Andrew George | $1,442,000 | Or | |
| Bark Andrew George | $1,442,000 | Or | |
| Preisendorfer Russell W | $1,650,000 | Tg | |
| Vitello Ariel Tsutayo | -- | Tg | |
| Maertz Allen Takichi | -- | -- | |
| Vitello Lauren | -- | -- | |
| Maertz Allen Takichi | -- | -- | |
| Maertz Warburton August | -- | -- |
Source: Public Records
Tax History Compared to Growth
Tax History
| Year | Tax Paid | Tax Assessment Tax Assessment Total Assessment is a certain percentage of the fair market value that is determined by local assessors to be the total taxable value of land and additions on the property. | Land | Improvement |
|---|---|---|---|---|
| 2025 | $13,084 | $5,146,100 | $2,350,300 | $2,795,800 |
| 2024 | $13,084 | $3,858,300 | $2,209,300 | $1,649,000 |
| 2023 | $14,922 | $4,463,300 | $2,209,300 | $2,254,000 |
| 2022 | $10,923 | $3,220,900 | $2,209,300 | $1,011,600 |
| 2021 | $9,147 | $2,713,300 | $1,974,300 | $739,000 |
| 2020 | $11,261 | $3,317,500 | $2,256,300 | $1,061,200 |
| 2019 | $11,569 | $3,385,400 | $2,256,300 | $1,129,100 |
| 2018 | $10,739 | $3,148,400 | $2,021,300 | $1,127,100 |
| 2017 | $8,837 | $2,604,800 | $1,692,200 | $912,600 |
| 2016 | $8,659 | $2,554,000 | $1,645,200 | $908,800 |
| 2015 | $14,325 | $2,387,500 | $1,645,200 | $742,300 |
| 2014 | -- | $2,111,800 | $1,551,200 | $560,600 |
Source: Public Records
Map
Nearby Homes
- 59-199 Ke Nui Rd
- 59-188 Kamehameha Hwy
- 59-147 Ke Nui Rd Unit 147
- 59-329 Ke Nui Rd
- 59-355 Ke Nui Rd
- 59-75 Hoalua St
- 59-377 Ke Nui Rd
- 59-130 Kekiliohulani St Unit 130
- 59-153 Kekiliohulani St
- 58-358 Kamehameha Hwy Unit A
- 58-1 Makanale St Unit A
- 58-1 Makanale St
- 58-1 Makanale St Unit B
- 59-471 Ke Waena Rd
- 59-502 Kamehameha Hwy Unit B
- 59-495 Ke Waena Rd
- 59-414 Makana Rd Unit 1
- 59-414 Makana Rd Unit 2
- 58-153 Napoonala Place
- 58-248 Kamehameha Hwy Unit C1
- 59-209 Ke Nui Rd
- 59-209 Ke Nui Rd Unit E
- 59-209 Ke Nui Rd Unit B
- 59-209 Ke Nui Rd Unit C
- 59-209A Ke Nui Rd
- 59-215 Ke Nui Rd
- 59-215 Ke Nui Rd Unit C
- 59-215 Ke Nui Rd Unit B
- 59-215 Ke Nui Rd
- 59-215 Ke Nui Rd Unit C
- 59-205 Ke Nui Rd
- 59-199 Ke Nui Rd Unit A
- 59-199 Ke Nui Rd
- 59-199 Ke Nui Rd
- 59-199 Ke Nui Rd Unit C
- 59-199 Ke Nui Rd Unit A&B
- 59-199 Ke Nui Rd
- 59-221 Ke Nui Rd
- 59-221 Ke Nui Rd Unit A
- 59-221 Ke Nui Rd Unit B