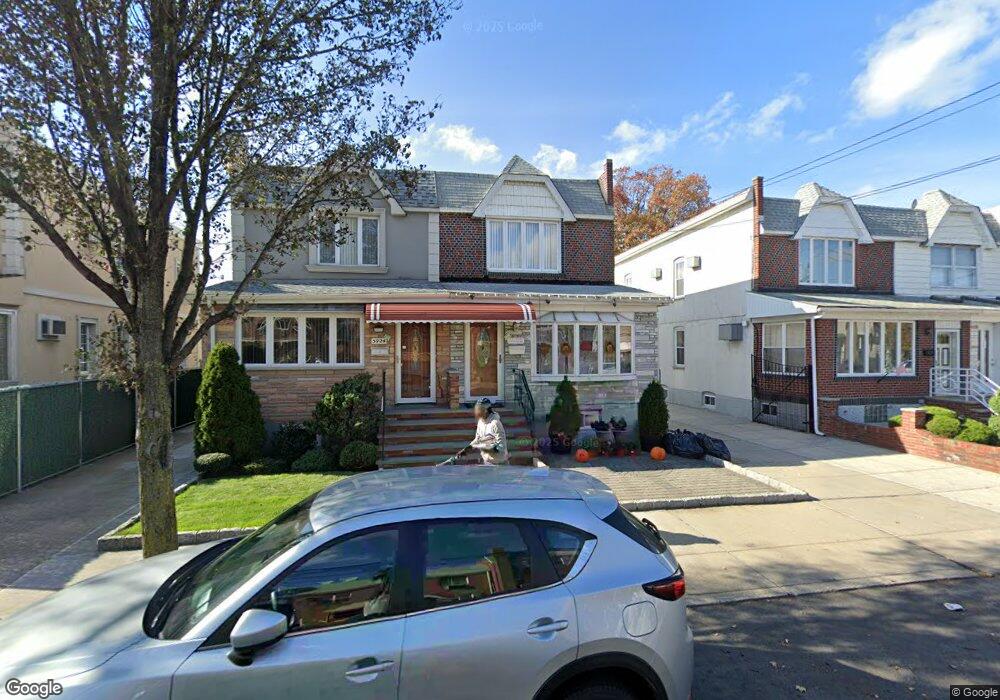
59-22 71st St Maspeth, NY 11378
Maspeth NeighborhoodEstimated Value: $905,000 - $1,065,000
3
Beds
3
Baths
1,558
Sq Ft
$648/Sq Ft
Est. Value
About This Home
This home is located at 59-22 71st St, Maspeth, NY 11378 and is currently estimated at $1,009,612, approximately $648 per square foot. 59-22 71st St is a home located in Queens County with nearby schools including Ps 58 School Of Heroes, IS 73 - The Frank Sansivieri School, and Grover Cleveland High School.
Ownership History
Date
Name
Owned For
Owner Type
Purchase Details
Closed on
Feb 6, 2015
Sold by
Palermo Giuseppe
Bought by
Mullins Craig and Mullins Laura
Current Estimated Value
Home Financials for this Owner
Home Financials are based on the most recent Mortgage that was taken out on this home.
Original Mortgage
$594,000
Outstanding Balance
$450,594
Interest Rate
3.66%
Mortgage Type
New Conventional
Estimated Equity
$559,018
Purchase Details
Closed on
Nov 12, 2013
Sold by
Palermo Giuseppe and Palermo Josephine
Bought by
Palermo Giuseppe
Purchase Details
Closed on
Aug 9, 2004
Sold by
Palermo Giuseppe and Palermo Mimi
Bought by
Palermo Giuseppe and Palermo Josephine
Purchase Details
Closed on
Feb 5, 1997
Sold by
Palermo Mimi
Bought by
Palermo Giuseppe and Palermo Mimi
Create a Home Valuation Report for This Property
The Home Valuation Report is an in-depth analysis detailing your home's value as well as a comparison with similar homes in the area
Home Values in the Area
Average Home Value in this Area
Purchase History
| Date | Buyer | Sale Price | Title Company |
|---|---|---|---|
| Mullins Craig | $660,000 | -- | |
| Mullins Craig | $660,000 | -- | |
| Mullins Craig | $660,000 | -- | |
| Palermo Giuseppe | -- | -- | |
| Palermo Giuseppe | -- | -- | |
| Palermo Giuseppe | -- | -- | |
| Palermo Giuseppe | -- | -- | |
| Palermo Giuseppe | -- | -- | |
| Palermo Giuseppe | -- | -- |
Source: Public Records
Mortgage History
| Date | Status | Borrower | Loan Amount |
|---|---|---|---|
| Open | Mullins Craig | $594,000 | |
| Closed | Mullins Craig | $594,000 | |
| Closed | Palermo Giuseppe | $0 |
Source: Public Records
Tax History
| Year | Tax Paid | Tax Assessment Tax Assessment Total Assessment is a certain percentage of the fair market value that is determined by local assessors to be the total taxable value of land and additions on the property. | Land | Improvement |
|---|---|---|---|---|
| 2025 | $7,513 | $38,695 | $13,703 | $24,992 |
| 2024 | $7,513 | $37,404 | $13,093 | $24,311 |
| 2023 | $7,168 | $35,686 | $11,641 | $24,045 |
| 2022 | $6,781 | $55,560 | $20,100 | $35,460 |
| 2021 | $6,786 | $57,300 | $20,100 | $37,200 |
| 2020 | $6,826 | $52,440 | $20,100 | $32,340 |
| 2019 | $6,520 | $51,180 | $20,100 | $31,080 |
| 2018 | $6,062 | $29,738 | $11,624 | $18,114 |
| 2017 | $5,770 | $28,305 | $13,883 | $14,422 |
| 2016 | $5,372 | $28,305 | $13,883 | $14,422 |
| 2015 | $3,221 | $26,872 | $14,942 | $11,930 |
| 2014 | $3,221 | $25,975 | $14,640 | $11,335 |
Source: Public Records
Map
Nearby Homes
- 5916 71st St
- 59-14 71st St
- 5914 71st St
- 5920 71st St
- 59 W 71st St
- 59 W 71st St Unit 7D
- 59 W 71st St Unit 1A
- 59 W 71st St Unit 9D
- 59 W 71st St Unit 10A
- 59 W 71st St Unit 9A
- 59 W 71st St Unit 3A
- 59 W 71st St Unit 10B
- 59 W 71st St Unit 9B
- 59 W 71st St Unit 7A
- 59 W 71st St Unit 10C
- 59 W 71st St Unit 3B
- 59 W 71st St Unit 8B
- 59 W 71st St Unit 3D
- 59 W 71st St Unit 7B
- 59 W 71st St Unit 2A
Your Personal Tour Guide
Ask me questions while you tour the home.