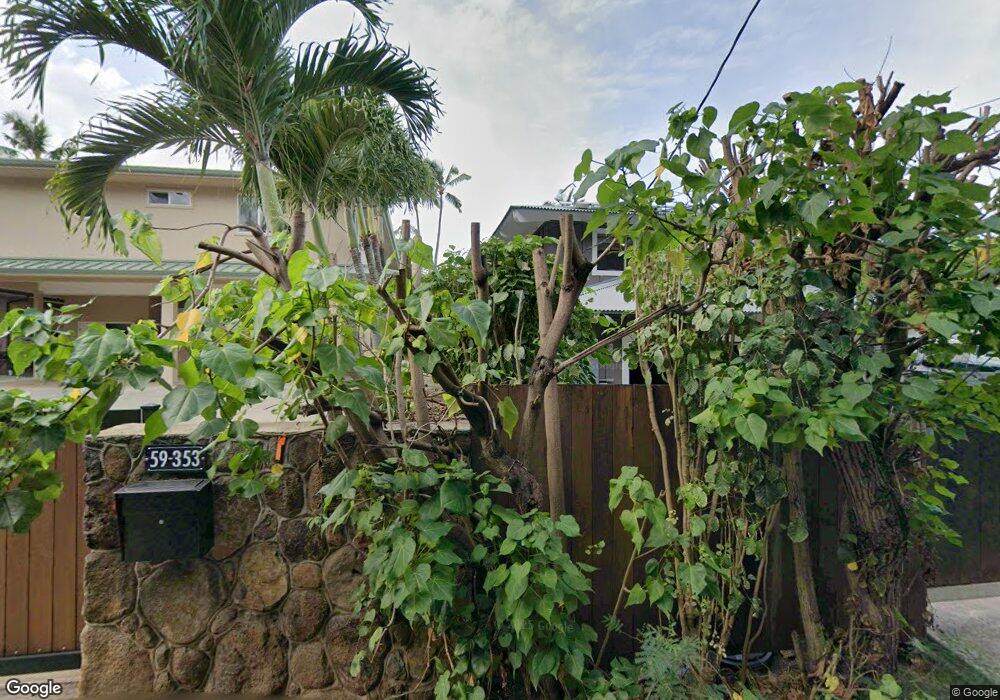
59-351 Ke Nui Rd Haleiwa, HI 96712
Estimated Value: $3,404,000 - $6,700,000
3
Beds
5
Baths
2,067
Sq Ft
$2,425/Sq Ft
Est. Value
About This Home
This home is located at 59-351 Ke Nui Rd, Haleiwa, HI 96712 and is currently estimated at $5,012,516, approximately $2,425 per square foot. 59-351 Ke Nui Rd is a home located in Honolulu County with nearby schools including Sunset Beach Elementary School and Kahuku High & Intermediate School.
Ownership History
Date
Name
Owned For
Owner Type
Purchase Details
Closed on
Jun 30, 2014
Sold by
Johnson Trent M and Johnson Peter R
Bought by
The Eveletha Irrevocable Trust and Johnson Peter R
Current Estimated Value
Purchase Details
Closed on
Dec 15, 2012
Sold by
Johnson Patricia L
Bought by
Johnson Trent M and Johnson Peter R
Purchase Details
Closed on
Dec 4, 2012
Sold by
Rene Julie
Bought by
Johnson Patricia L
Purchase Details
Closed on
Nov 29, 2010
Sold by
Johnson Patricia Lynn
Bought by
Johnson Patricia L and Patricia L Johnson Trust
Purchase Details
Closed on
Jun 29, 2009
Sold by
Cruz Cynthia Lee
Bought by
Rene Julie and The Mango Tree Trust
Purchase Details
Closed on
Apr 23, 2004
Sold by
Johnson Patricia Lynn and Brown Christine Irene
Bought by
Johnson Patricia Lynn and Brown Christine Irene
Purchase Details
Closed on
Nov 20, 1998
Sold by
Eick Jeffrey and Eick Nikki
Bought by
Thatcher June and June Thatcher Trust
Create a Home Valuation Report for This Property
The Home Valuation Report is an in-depth analysis detailing your home's value as well as a comparison with similar homes in the area
Home Values in the Area
Average Home Value in this Area
Purchase History
| Date | Buyer | Sale Price | Title Company |
|---|---|---|---|
| The Eveletha Irrevocable Trust | -- | None Available | |
| The Eveletha Irrevocable Trust | -- | None Available | |
| Johnson Trent M | -- | None Available | |
| Johnson Trent M | -- | None Available | |
| Johnson Patricia L | $580,000 | Tg | |
| Johnson Patricia L | $580,000 | Tg | |
| Johnson Patricia L | -- | None Available | |
| Rene Julie | $225,000 | Or | |
| Rene Julie | $238,000 | Or | |
| Johnson Patricia Lynn | -- | -- | |
| Thatcher June | $275,000 | -- |
Source: Public Records
Tax History Compared to Growth
Tax History
| Year | Tax Paid | Tax Assessment Tax Assessment Total Assessment is a certain percentage of the fair market value that is determined by local assessors to be the total taxable value of land and additions on the property. | Land | Improvement |
|---|---|---|---|---|
| 2025 | $14,810 | $4,472,400 | $3,335,400 | $1,137,000 |
| 2024 | $14,810 | $4,351,500 | $3,176,500 | $1,175,000 |
| 2023 | $16,815 | $5,004,300 | $3,176,500 | $1,827,800 |
| 2022 | $12,587 | $3,696,200 | $2,858,900 | $837,300 |
| 2021 | $10,466 | $3,090,300 | $2,541,200 | $549,100 |
| 2020 | $11,526 | $3,393,000 | $2,858,900 | $534,100 |
| 2019 | $12,279 | $3,588,400 | $2,858,900 | $729,500 |
| 2018 | $11,163 | $3,269,500 | $2,541,200 | $728,300 |
| 2017 | $21,326 | $2,869,600 | $2,170,600 | $699,000 |
| 2016 | $16,739 | $2,789,900 | $2,117,700 | $672,200 |
| 2015 | $12,706 | $2,117,700 | $2,117,700 | $0 |
| 2014 | -- | $1,954,200 | $1,826,500 | $127,700 |
Source: Public Records
Map
Nearby Homes
- 59-355 Ke Nui Rd
- 59-377 Ke Nui Rd
- 59-329 Ke Nui Rd
- 59-130 Kekiliohulani St Unit 130
- 59-199 A and B Ke Nui Rd
- 59-465 Kamehameha Hwy
- 59-153 Kekiliohulani St
- 59-471 Ke Waena Rd
- 59-495 Ke Waena Rd
- 59-199 Ke Nui Rd
- 59-414 Makana Rd Unit 1
- 59-414 Makana Rd Unit 2
- 59-535 Ke Iki Rd Unit A
- 59-147 Ke Nui Rd Unit 147
- 59-565 Ke Iki Rd Unit A
- 59-402 Wilinau Rd
- 59-555 Makana Rd
- 59-439 Alapio Rd
- 59-75 Hoalua St
- 59-496 Pupukea Rd
- 59-347 Ke Nui Rd
- 59-345 Ke Nui Rd
- 59-363 Ke Nui Rd
- 59-359 Ke Nui Rd
- 59-365 Ke Nui Rd
- 59-367 Ke Nui Rd
- 59-369 Ke Nui Rd
- 59-371 Ke Nui Rd
- 59-373 Ke Nui Rd
- 59-379 Ke Nui Rd
- 59-329 Ke Nui Rd
- 59-329 Ke Nui Rd Unit B
- 59-329 Ke Nui Rd Unit A
- 59-329 Ke Nui Rd Unit D
- 59-329 Ke Nui Rd
- 59 Kamehameha Hwy
- 59-323 Ke Nui Rd
- 59-381 Ke Nui Rd
- 59-319 Ke Nui Rd
- 59-385 Ke Nui Rd