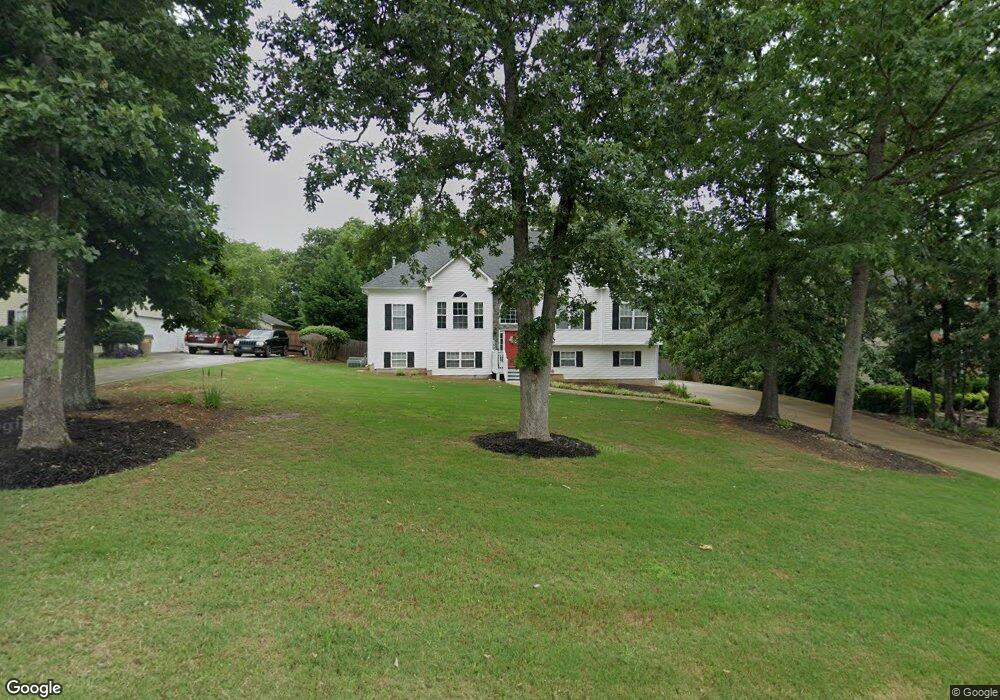
59 59 Red Fox Trail Euharlee, GA 30145
Estimated Value: $396,769 - $460,000
3
Beds
3
Baths
2,031
Sq Ft
$213/Sq Ft
Est. Value
About This Home
This home is located at 59 59 Red Fox Trail, Euharlee, GA 30145 and is currently estimated at $433,442, approximately $213 per square foot. 59 59 Red Fox Trail is a home located in Bartow County with nearby schools including Euharlee Elementary School, Woodland Middle School, and Woodland High School.
Ownership History
Date
Name
Owned For
Owner Type
Purchase Details
Closed on
Jul 19, 2018
Sold by
Chafin Antonio
Bought by
Coursey Michael and Coursey Mariana
Current Estimated Value
Home Financials for this Owner
Home Financials are based on the most recent Mortgage that was taken out on this home.
Original Mortgage
$224,852
Outstanding Balance
$193,638
Interest Rate
4.5%
Mortgage Type
FHA
Estimated Equity
$239,804
Purchase Details
Closed on
Aug 27, 2014
Sold by
Proctor Jack W
Bought by
Chafin Antonio and Chafin Carol
Home Financials for this Owner
Home Financials are based on the most recent Mortgage that was taken out on this home.
Original Mortgage
$185,000
Interest Rate
4.19%
Mortgage Type
New Conventional
Purchase Details
Closed on
Feb 9, 2011
Sold by
Glass Amy
Bought by
Proctor Jack
Purchase Details
Closed on
Nov 22, 2006
Sold by
Glass C Roye
Bought by
Glass Amy
Create a Home Valuation Report for This Property
The Home Valuation Report is an in-depth analysis detailing your home's value as well as a comparison with similar homes in the area
Home Values in the Area
Average Home Value in this Area
Purchase History
| Date | Buyer | Sale Price | Title Company |
|---|---|---|---|
| Coursey Michael | $229,000 | -- | |
| Chafin Antonio | $200,000 | -- | |
| Proctor Jack | -- | -- | |
| Glass Amy | -- | -- |
Source: Public Records
Mortgage History
| Date | Status | Borrower | Loan Amount |
|---|---|---|---|
| Open | Coursey Michael | $224,852 | |
| Previous Owner | Chafin Antonio | $185,000 |
Source: Public Records
Tax History
| Year | Tax Paid | Tax Assessment Tax Assessment Total Assessment is a certain percentage of the fair market value that is determined by local assessors to be the total taxable value of land and additions on the property. | Land | Improvement |
|---|---|---|---|---|
| 2025 | $3,445 | $146,970 | $28,000 | $118,970 |
| 2024 | $3,445 | $147,053 | $28,000 | $119,053 |
| 2023 | $3,700 | $125,878 | $28,000 | $97,878 |
| 2022 | $2,832 | $106,581 | $14,000 | $92,581 |
| 2021 | $2,121 | $83,164 | $14,000 | $69,164 |
| 2020 | $2,357 | $83,164 | $14,000 | $69,164 |
| 2019 | $2,200 | $76,570 | $12,000 | $64,570 |
| 2017 | $2,055 | $70,174 | $12,000 | $58,174 |
| 2016 | $1,893 | $64,160 | $12,000 | $52,160 |
| 2015 | $1,972 | $66,720 | $12,000 | $54,720 |
| 2014 | $1,938 | $63,600 | $12,000 | $51,600 |
| 2013 | -- | $65,040 | $12,000 | $53,040 |
Source: Public Records
Map
Nearby Homes
- 230 Groveton Ct
- 209 Groveton Ct
- 110 Cherry Glen Way
- 1006 Blossom Ln
- 118 Cherry Glen Way
- 1001 Rainier Dr
- 132 Cherry Glen Way
- 138 Cherry Glen Way
- 11 Dove Pointe
- 10 Dove Pointe
- 8 Ripplewood Trail
- 47 Cliffhanger Pointe SW
- 42 River Oaks Dr SW
- 58 Ferguson Dr
- 0 Euharlee Rd SW Unit 10518934
- 14 Cathedral Heights
- 68 Lazy Water Dr SW
- 113 Amberwood Ln
- 29 Wisteria Trail SW
- 12 Creek Bend Ct SW
- 59 Red Fox Trail
- 61 Red Fox Trail
- 57 Red Fox Trail
- 57 Red Fox Trail
- 57 Red Fox Trail
- 57 Red Fox Trail Unit 87
- 63 Red Fox Trail
- 55 Red Fox Trail
- 60 Red Fox Trail
- 65 Red Fox Trail
- 56 Red Fox Trail
- 53 Red Fox Trail
- 64 Red Fox Trail
- 21 Bucky St
- 51 Red Fox Trail
- 15 Bucky St
- 36 Friendship Rd
- 52 Red Fox Trail
- 49 Red Fox Trail
- 25 Bucky St
Your Personal Tour Guide
Ask me questions while you tour the home.