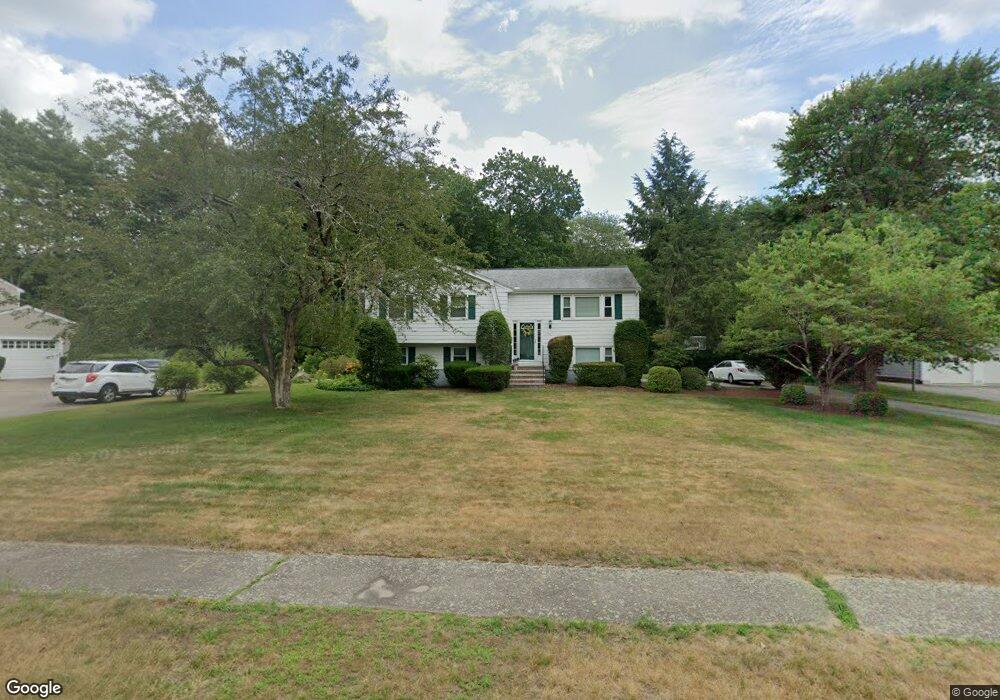
59 Alden St Foxboro, MA 02035
Estimated Value: $602,857 - $727,000
3
Beds
3
Baths
1,102
Sq Ft
$595/Sq Ft
Est. Value
About This Home
This home is located at 59 Alden St, Foxboro, MA 02035 and is currently estimated at $656,214, approximately $595 per square foot. 59 Alden St is a home located in Norfolk County with nearby schools including Foxborough High School, Foxborough Regional Charter School, and The Sage School.
Ownership History
Date
Name
Owned For
Owner Type
Purchase Details
Closed on
Feb 23, 2001
Sold by
Hagan Edward and Hagan Patricia A
Bought by
Lowey Christopher J and Lowey Kathleen D
Current Estimated Value
Home Financials for this Owner
Home Financials are based on the most recent Mortgage that was taken out on this home.
Original Mortgage
$135,000
Outstanding Balance
$48,679
Interest Rate
6.89%
Mortgage Type
Purchase Money Mortgage
Estimated Equity
$607,535
Purchase Details
Closed on
Dec 30, 1992
Sold by
King Margaret R
Bought by
Dolan Mark J and Dolan Jane M
Home Financials for this Owner
Home Financials are based on the most recent Mortgage that was taken out on this home.
Original Mortgage
$150,300
Interest Rate
8.32%
Mortgage Type
Purchase Money Mortgage
Create a Home Valuation Report for This Property
The Home Valuation Report is an in-depth analysis detailing your home's value as well as a comparison with similar homes in the area
Home Values in the Area
Average Home Value in this Area
Purchase History
| Date | Buyer | Sale Price | Title Company |
|---|---|---|---|
| Lowey Christopher J | $268,000 | -- | |
| Dolan Mark J | $167,000 | -- |
Source: Public Records
Mortgage History
| Date | Status | Borrower | Loan Amount |
|---|---|---|---|
| Open | Dolan Mark J | $135,000 | |
| Previous Owner | Dolan Mark J | $150,300 | |
| Previous Owner | Dolan Mark J | $5,000 | |
| Previous Owner | Dolan Mark J | $117,000 |
Source: Public Records
Tax History
| Year | Tax Paid | Tax Assessment Tax Assessment Total Assessment is a certain percentage of the fair market value that is determined by local assessors to be the total taxable value of land and additions on the property. | Land | Improvement |
|---|---|---|---|---|
| 2025 | $6,668 | $504,400 | $217,400 | $287,000 |
| 2024 | $6,351 | $470,100 | $217,400 | $252,700 |
| 2023 | $6,169 | $434,100 | $207,000 | $227,100 |
| 2022 | $5,962 | $410,600 | $198,000 | $212,600 |
| 2021 | $5,529 | $375,100 | $180,000 | $195,100 |
| 2020 | $5,168 | $354,700 | $180,000 | $174,700 |
| 2019 | $5,104 | $347,200 | $171,400 | $175,800 |
| 2018 | $5,086 | $349,100 | $171,400 | $177,700 |
| 2017 | $4,965 | $330,100 | $160,200 | $169,900 |
| 2016 | $4,802 | $324,000 | $154,100 | $169,900 |
| 2015 | $4,603 | $303,000 | $130,200 | $172,800 |
| 2014 | $4,503 | $300,400 | $127,600 | $172,800 |
Source: Public Records
Map
Nearby Homes
- 9 Independence Dr Unit 9
- 261 East St
- 619 N Main St
- 165 Chestnut St Unit 2
- 13 Summerville Rd Unit 13
- 233 Central St
- 3 Willow St
- 147 Chestnut St Unit A
- 147 Chestnut St Unit B
- 26 Fuller Rd Unit 6
- 157 Central St
- 25 Kingman Ave
- 356 Central St
- 81 Chilson Ave
- 26 Fredric Ln
- 22 Pleasant St Unit B
- 1 Maura Elizabeth Ln
- 122 Samoset Ave
- 67 Carpenter St
- 266 N Main St Unit 3
Your Personal Tour Guide
Ask me questions while you tour the home.