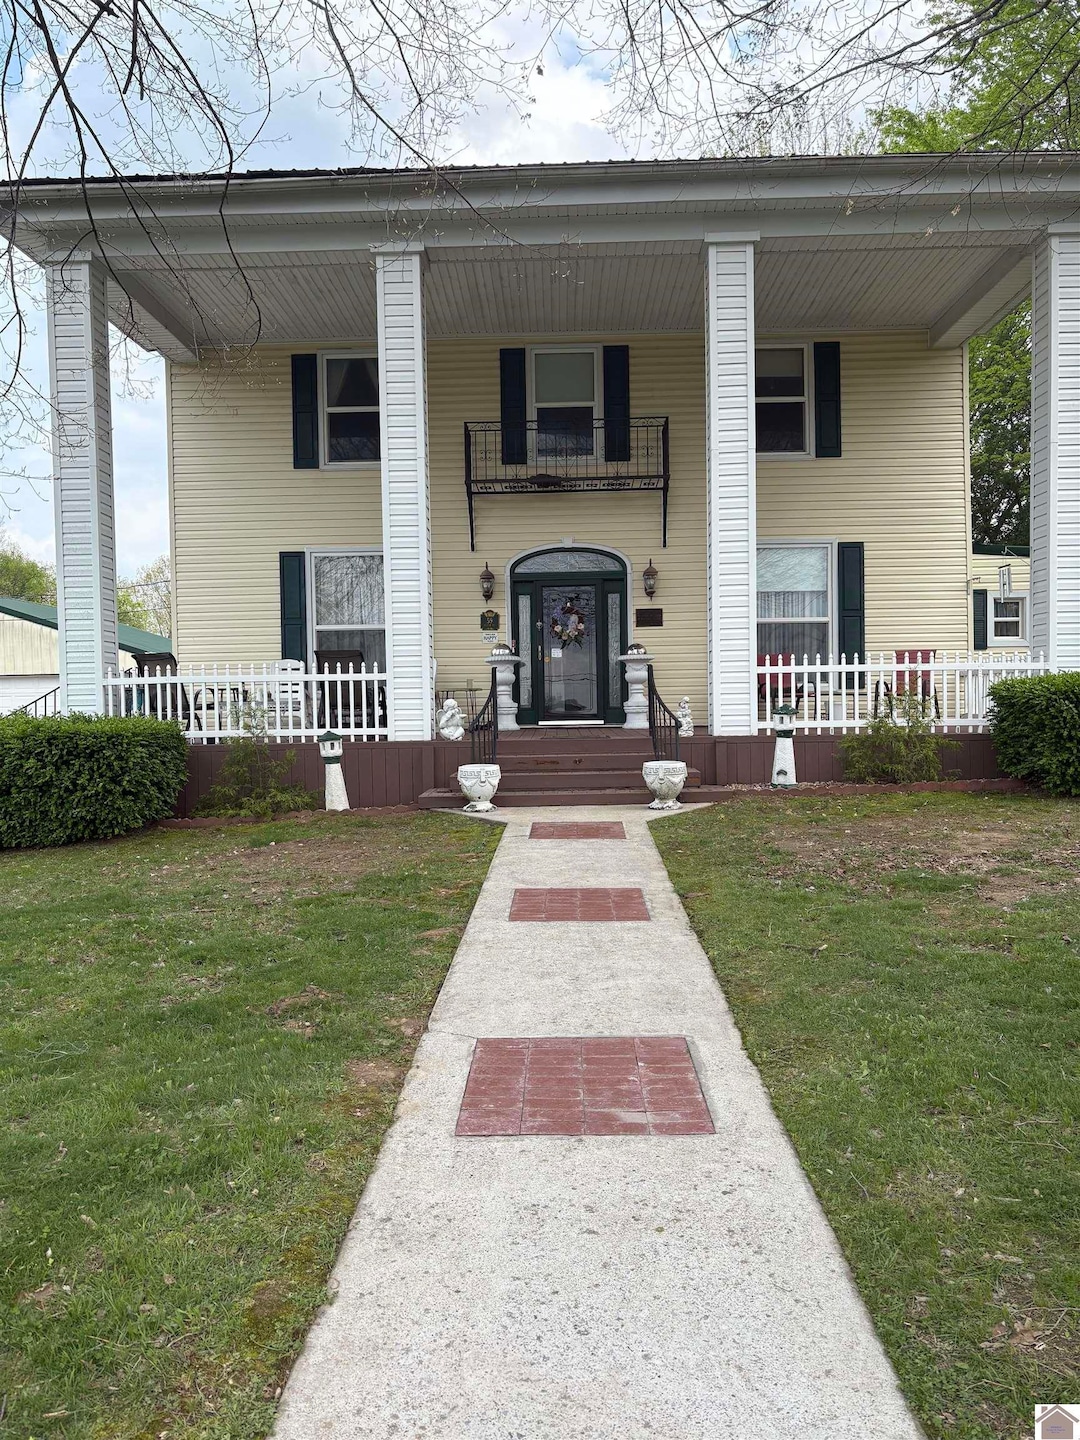

59 Aspen St Calvert City, KY 42029
Estimated payment $1,552/month
Highlights
- 3.47 Acre Lot
- Lake Property
- Deck
- North Marshall Middle School Rated 9+
- Fireplace in Kitchen
- Wood Flooring
About This Home
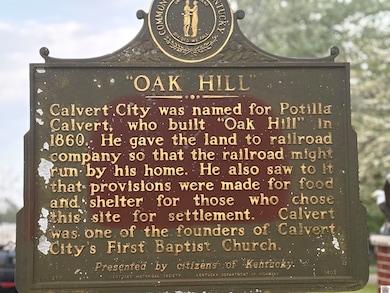
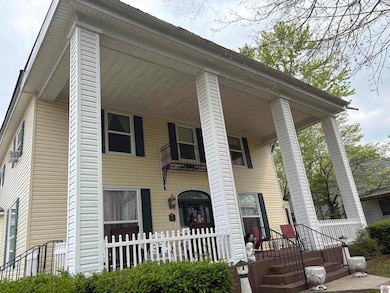
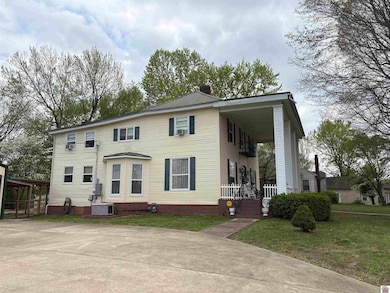
Own a piece of KY history with Calvert City’s Oak Hill, which is on the National Register of Historic Homes, built in 1853 by Calvert City’s founder. Extensively updated in 2010, this 4+bedrms 3 bath home has a 1200 sq ft garage/workshop, mower shed and small storage shed with a circular concrete drive. Main floor combine living/dining spacious country kitchen w/ island, granite countertops, mud rm, utility. M bedrm & 2 baths on main floor. 2nd floor sunroom overlooking the back patio and serene rear area of 3.4 ac property. Office, sitting/bedrm and 2-guest bedrms, bath on upper level. Front and back porch sitting at its best w/ outdoor entertainment area. Lovely yard, grounds and entertainment areas. If you love older country style homes, peaceful setting and have the benefits of city living in a golf cart community known for its great park system, City events, friendly neighbors, convenient to shopping, restaurants, walking trails, churches and library, this is the home!
Home Details
Home Type
- Single Family
Est. Annual Taxes
- $614
Year Built
- Built in 1853
Lot Details
- 3.47 Acre Lot
- Interior Lot
- Lot Has A Rolling Slope
- Landscaped with Trees
Home Design
- Frame Construction
- Metal Roof
- Vinyl Siding
Interior Spaces
- 3,300 Sq Ft Home
- 2-Story Property
- Sheet Rock Walls or Ceilings
- Ceiling height of 9 feet or more
- Ceiling Fan
- Multiple Fireplaces
- Vinyl Clad Windows
- Living Room with Fireplace
- Formal Dining Room
- Workshop
- Utility Room
- Crawl Space
- Storage In Attic
Kitchen
- Eat-In Kitchen
- Built-In Oven
- Range
- Microwave
- Dishwasher
- Disposal
- Fireplace in Kitchen
Flooring
- Wood
- Carpet
- Ceramic Tile
- Vinyl
Bedrooms and Bathrooms
- 5 Bedrooms
- Primary Bedroom on Main
- Walk-In Closet
- 3 Full Bathrooms
- Double Vanity
- Separate Shower
Laundry
- Laundry in Utility Room
- Dryer
- Washer
Home Security
- Home Security System
- Storm Doors
- Fire and Smoke Detector
Parking
- 2 Car Detached Garage
- Heated Garage
- Workshop in Garage
- Garage Door Opener
- Circular Driveway
Outdoor Features
- Lake Property
- Deck
- Covered Patio or Porch
- Outbuilding
Utilities
- Forced Air Heating and Cooling System
- Window Unit Cooling System
- Space Heater
- Heating System Uses Natural Gas
- Heat Pump System
- Electric Water Heater
- Cable TV Available
Map
Home Values in the Area
Average Home Value in this Area
Tax History
| Year | Tax Paid | Tax Assessment Tax Assessment Total Assessment is a certain percentage of the fair market value that is determined by local assessors to be the total taxable value of land and additions on the property. | Land | Improvement |
|---|---|---|---|---|
| 2024 | $614 | $120,000 | $13,000 | $107,000 |
| 2023 | $637 | $120,000 | $13,000 | $107,000 |
| 2022 | $716 | $120,000 | $13,000 | $107,000 |
| 2021 | $588 | $105,000 | $13,000 | $92,000 |
| 2020 | $603 | $105,000 | $13,000 | $92,000 |
| 2019 | $602 | $105,000 | $13,000 | $92,000 |
| 2018 | $620 | $105,000 | $13,000 | $92,000 |
| 2017 | $620 | $105,000 | $13,000 | $92,000 |
| 2016 | $608 | $103,000 | $10,000 | $93,000 |
| 2015 | $611 | $103,000 | $10,000 | $93,000 |
| 2014 | $618 | $103,000 | $0 | $0 |
| 2010 | -- | $89,900 | $10,000 | $79,900 |
Property History
| Date | Event | Price | List to Sale | Price per Sq Ft |
|---|---|---|---|---|
| 10/10/2025 10/10/25 | Price Changed | $285,000 | -1.4% | $86 / Sq Ft |
| 09/18/2025 09/18/25 | Price Changed | $289,000 | -3.3% | $88 / Sq Ft |
| 09/03/2025 09/03/25 | For Sale | $299,000 | 0.0% | $91 / Sq Ft |
| 07/05/2025 07/05/25 | Off Market | $299,000 | -- | -- |
| 06/26/2025 06/26/25 | Price Changed | $299,000 | -3.5% | $91 / Sq Ft |
| 06/10/2025 06/10/25 | Price Changed | $309,900 | -3.1% | $94 / Sq Ft |
| 04/15/2025 04/15/25 | For Sale | $319,900 | -- | $97 / Sq Ft |
Purchase History
| Date | Type | Sale Price | Title Company |
|---|---|---|---|
| Interfamily Deed Transfer | -- | None Available | |
| Warranty Deed | $89,900 | None Available | |
| Commissioners Deed | -- | None Available |
Source: Western Kentucky Regional MLS
MLS Number: 131379
APN: 0C-05-02-099.000000
Disclaimer: Certain information contained herein is derived from information provided by parties other than Homes.com. All information provided is deemed reliable, but is not guaranteed to be accurate and should be independently verified.
![]() IDX information is provided exclusively for personal, non-commercial use, and may not be used for any purpose other than to identify prospective properties consumers may be interested in purchasing. Information is deemed reliable but not guaranteed.
IDX information is provided exclusively for personal, non-commercial use, and may not be used for any purpose other than to identify prospective properties consumers may be interested in purchasing. Information is deemed reliable but not guaranteed.
- 78 Ash St
- 271 E 3rd Ave
- 43 2nd Ave SE
- 587 S Main St Unit 583 S Main St
- 581 S Main St
- 680 Chestnut St
- 647 Elder St
- 771 Chestnut St
- 574 Fern Cir
- 000 Quail Rd Unit Oaklawn Lane
- 00 Pine St
- 0000 Prince John Way
- 576 Hickory St
- 808 Oak Park Blvd
- Lot 7 Edison Dr
- 359 Ironwood Dr
- 4300 U S 62
- 1740 Colorado St
- 1040 Lone Valley Rd
- 300 Scillion Dr
- 67 Country Club Ln
- 151 Henry Sledd Rd Unit A
- 2216 Dyke Rd
- 107 Molloy Ct
- 103 Molloy Ct
- 900 Elm St Unit B
- 2150 Irvin Cobb Dr
- 430 Adams St
- 111 Market House Square Unit 201
- 219 Broadway St
- 229 Broadway St Unit 301
- 525 Broadway St
- 820 Washington St
- 520 Madison St
- 411 N 7th St Unit 1
- 815 Monroe St
- 1107 Markham Ave
- 326 N 16th St
- 3312 River Oaks Blvd
- 3730 Hinkleville Rd
