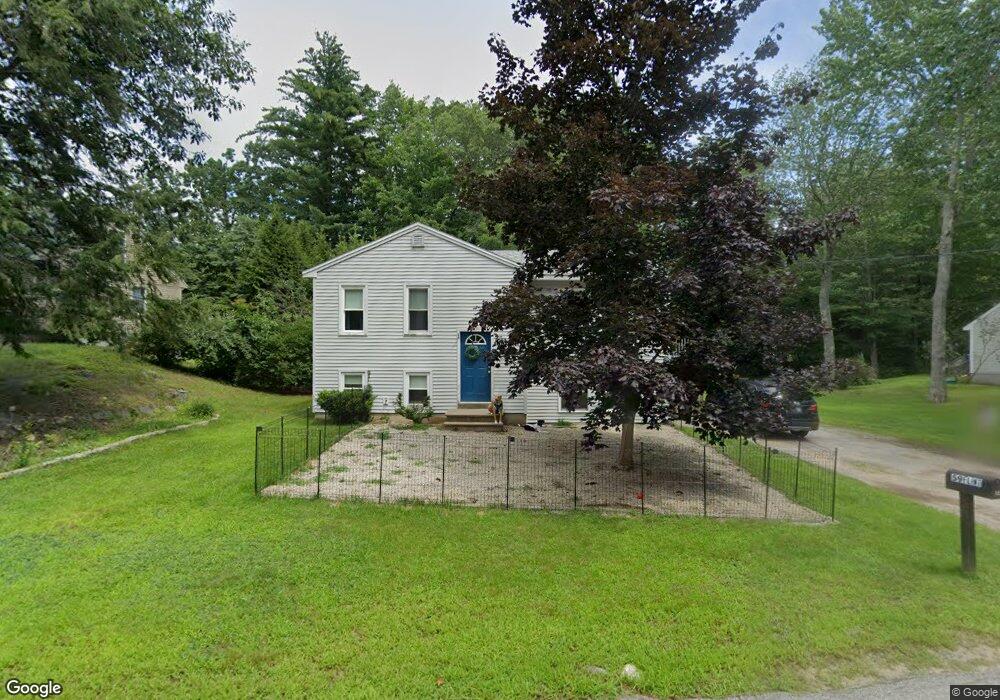
59 Barbara St Springvale, ME 04083
Estimated Value: $276,000 - $356,155
3
Beds
1
Bath
1,400
Sq Ft
$236/Sq Ft
Est. Value
About This Home
This home is located at 59 Barbara St, Springvale, ME 04083 and is currently estimated at $330,539, approximately $236 per square foot. 59 Barbara St is a home located in York County with nearby schools including St Thomas Consolidated School and Sanford Christian Academy.
Ownership History
Date
Name
Owned For
Owner Type
Purchase Details
Closed on
Oct 31, 2013
Sold by
Lindquist Keith
Bought by
Flint 3Rd Philip M and Flint Megan M
Current Estimated Value
Home Financials for this Owner
Home Financials are based on the most recent Mortgage that was taken out on this home.
Original Mortgage
$145,920
Outstanding Balance
$108,746
Interest Rate
4.52%
Mortgage Type
New Conventional
Estimated Equity
$221,793
Purchase Details
Closed on
Jul 19, 2012
Sold by
Owens Brian E
Bought by
Lindquist Keith
Create a Home Valuation Report for This Property
The Home Valuation Report is an in-depth analysis detailing your home's value as well as a comparison with similar homes in the area
Home Values in the Area
Average Home Value in this Area
Purchase History
| Date | Buyer | Sale Price | Title Company |
|---|---|---|---|
| Flint 3Rd Philip M | -- | -- | |
| Flint 3Rd Philip M | -- | -- | |
| Lindquist Keith | $60,500 | -- | |
| Lindquist Keith | $60,500 | -- |
Source: Public Records
Mortgage History
| Date | Status | Borrower | Loan Amount |
|---|---|---|---|
| Open | Flint 3Rd Philip M | $145,920 | |
| Closed | Lindquist Keith | $145,920 |
Source: Public Records
Tax History
| Year | Tax Paid | Tax Assessment Tax Assessment Total Assessment is a certain percentage of the fair market value that is determined by local assessors to be the total taxable value of land and additions on the property. | Land | Improvement |
|---|---|---|---|---|
| 2025 | $4,415 | $258,200 | $38,800 | $219,400 |
| 2024 | $3,882 | $240,500 | $38,800 | $201,700 |
| 2023 | $3,611 | $238,500 | $38,800 | $199,700 |
| 2022 | $3,530 | $238,500 | $38,800 | $199,700 |
| 2021 | $3,581 | $197,000 | $38,800 | $158,200 |
| 2020 | $3,445 | $170,900 | $38,800 | $132,100 |
| 2019 | $3,004 | $145,100 | $38,800 | $106,300 |
| 2018 | $2,882 | $140,600 | $38,800 | $101,800 |
| 2017 | $2,916 | $140,600 | $38,800 | $101,800 |
| 2016 | $2,879 | $126,600 | $38,800 | $87,800 |
| 2015 | $2,731 | $123,900 | $39,600 | $84,300 |
| 2014 | $2,679 | $123,900 | $39,600 | $84,300 |
| 2013 | -- | $123,900 | $39,600 | $84,300 |
Source: Public Records
Map
Nearby Homes
- 11 Nathan Ct
- 45 Payne St
- 39 Payne St
- 5 Goodwin St
- 6 Harris St
- 5 Allenson St
- 27 Weeman St
- 14 Pleasant St
- 3 George St
- 51 Pleasant St
- 446 Main St
- 2 Kirk St
- 21 Signal St Unit I-3
- 17 Signal St Unit I-1
- 19 Signal St Unit I-2
- R6-41-S3 Railroad Ave
- R6-41-S2 Railroad Ave
- R6-41-S4 Railroad Ave
- 24 Witham St Unit 16
- TBD Elm St
Your Personal Tour Guide
Ask me questions while you tour the home.