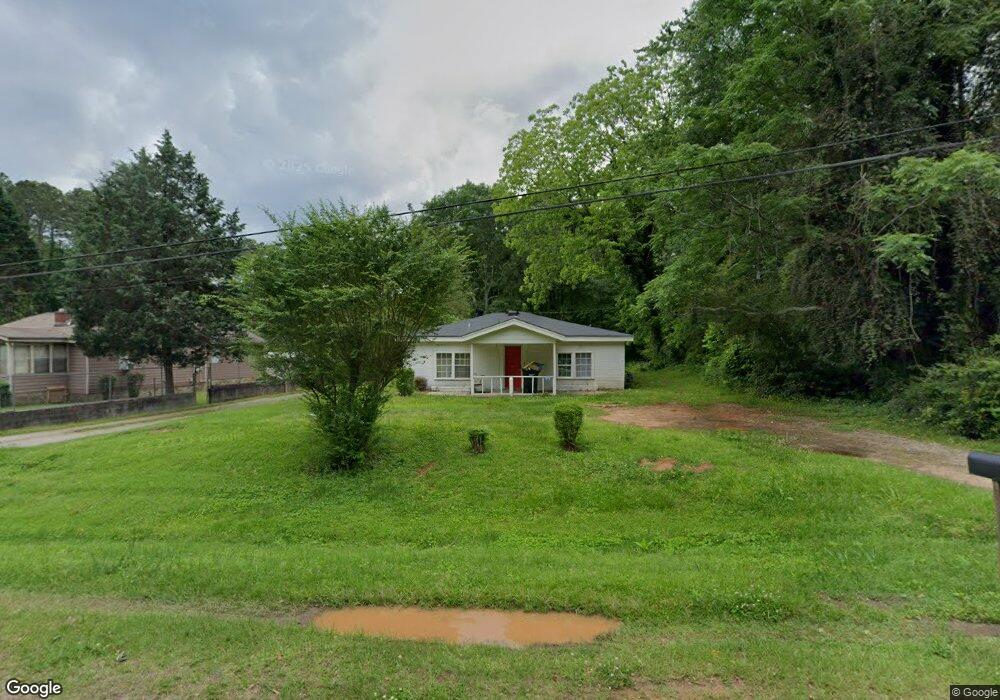
59 Belk Rd Newnan, GA 30263
Estimated Value: $177,000 - $263,000
2
Beds
2
Baths
2,048
Sq Ft
$109/Sq Ft
Est. Value
About This Home
This home is located at 59 Belk Rd, Newnan, GA 30263 and is currently estimated at $223,028, approximately $108 per square foot. 59 Belk Rd is a home located in Coweta County with nearby schools including Elm Street Elementary School, Evans Middle School, and Newnan High School.
Ownership History
Date
Name
Owned For
Owner Type
Purchase Details
Closed on
Dec 29, 2023
Sold by
Nicoya Realty Llc
Bought by
Old Door Investments Llc
Current Estimated Value
Home Financials for this Owner
Home Financials are based on the most recent Mortgage that was taken out on this home.
Original Mortgage
$207,000
Outstanding Balance
$181,969
Interest Rate
7.22%
Mortgage Type
New Conventional
Estimated Equity
$41,059
Purchase Details
Closed on
Jul 21, 2023
Sold by
Southern State Investments Llc
Bought by
Sanchez Agustin
Purchase Details
Closed on
Jul 12, 2023
Sold by
Southern State Investments Llc
Bought by
Nicoya Realty Llc
Purchase Details
Closed on
Jan 1, 2017
Sold by
Knight Nathan Gene
Bought by
Nba Special Properties Llc
Purchase Details
Closed on
Nov 4, 2002
Sold by
Knight Nathan
Bought by
Knight Ann Brady
Purchase Details
Closed on
Sep 10, 1974
Bought by
Knight Nathan
Create a Home Valuation Report for This Property
The Home Valuation Report is an in-depth analysis detailing your home's value as well as a comparison with similar homes in the area
Home Values in the Area
Average Home Value in this Area
Purchase History
| Date | Buyer | Sale Price | Title Company |
|---|---|---|---|
| Old Door Investments Llc | $100,000 | -- | |
| Sanchez Agustin | $100,000 | -- | |
| Nicoya Realty Llc | -- | -- | |
| Southern State Investments Llc | -- | -- | |
| Nba Special Properties Llc | -- | -- | |
| Knight Ann Brady | -- | -- | |
| Knight Nathan | $2,500 | -- |
Source: Public Records
Mortgage History
| Date | Status | Borrower | Loan Amount |
|---|---|---|---|
| Open | Old Door Investments Llc | $207,000 |
Source: Public Records
Tax History Compared to Growth
Tax History
| Year | Tax Paid | Tax Assessment Tax Assessment Total Assessment is a certain percentage of the fair market value that is determined by local assessors to be the total taxable value of land and additions on the property. | Land | Improvement |
|---|---|---|---|---|
| 2024 | $1,966 | $86,018 | $4,640 | $81,378 |
| 2023 | $1,966 | $42,345 | $4,640 | $37,705 |
| 2022 | $1,009 | $41,481 | $4,640 | $36,841 |
| 2021 | $989 | $36,801 | $4,640 | $32,161 |
| 2020 | $1,011 | $36,801 | $4,640 | $32,161 |
| 2019 | $786 | $26,168 | $4,000 | $22,168 |
| 2018 | $791 | $26,168 | $4,000 | $22,168 |
| 2017 | $787 | $26,168 | $4,000 | $22,168 |
| 2016 | $788 | $26,168 | $4,000 | $22,168 |
| 2015 | $789 | $26,168 | $4,000 | $22,168 |
| 2014 | $808 | $26,168 | $4,000 | $22,168 |
Source: Public Records
Map
Nearby Homes
- 25 Highland Park Dr
- 5 Westgate Park Ln
- 0 W Hwy 34 Unit 10379383
- 0 W Hwy 34 Unit 7457396
- 8 Westgate Park Ct
- 18 Belmont Park Ln
- 66 Westside School Rd
- 100 Lovelace St
- 169 W Washington St
- 2 Belmont Park Dr
- 25 Westgate Park Dr
- 4 Thomas Way
- 0 Benelli Ridge Unit 10429105
- 3 Center Ct
- 14 Hamilton Bohannon Dr
- 85 Franklin Rd
- 16 Hamilton Bohannon Dr
- 7 Maple Dr
- 18 Rutherford Dr Unit LOT 28
- 97 W Washington St
- 61 Belk Rd
- 65 Belk Rd
- 71 Belk Rd
- 73 Belk Rd
- 73R Belk Rd
- 24 Helen St
- 10 Trotter Ct
- 11 Trotter Ct
- 11 Trotter Ct Unit 91
- 15 Trotter Ct
- 15 Trotter Ct
- 15 Trotter Ct Unit 92
- 15 Trotter Ct Unit 93
- 19 Trotter Ct Unit 93
- 19 Trotter Ct
- 23 Trotter Ct
- 27 Trotter Ct
- 83 Belk Rd
- 114 Belmont Park Dr
- 123 Belmont Park Dr