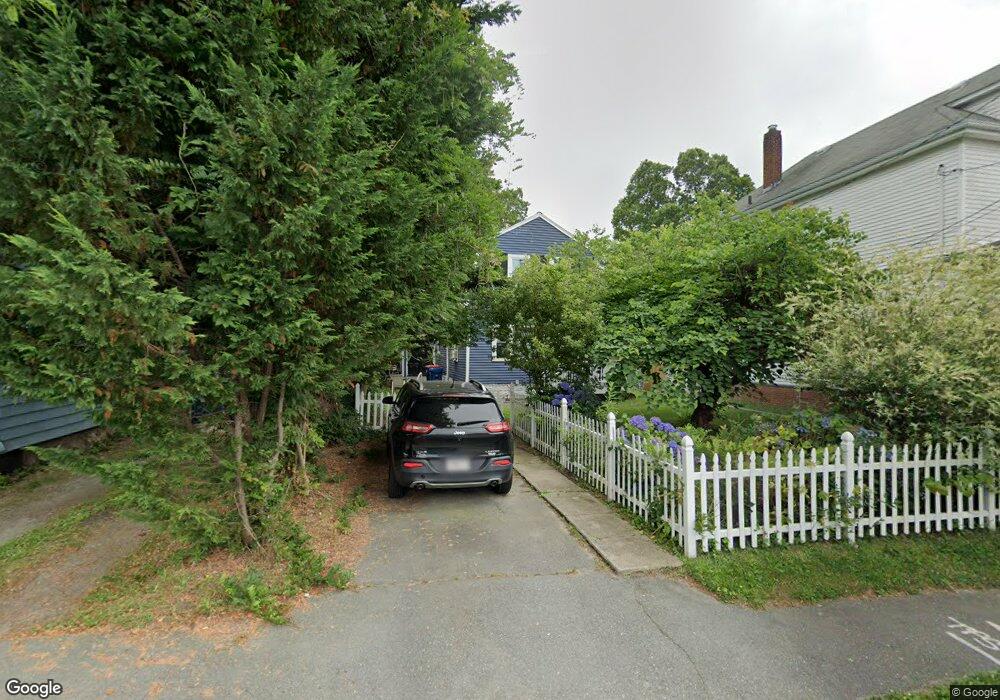
59 Bridge St Fairhaven, MA 02719
Estimated Value: $340,000 - $448,000
3
Beds
1
Bath
1,292
Sq Ft
$319/Sq Ft
Est. Value
About This Home
This home is located at 59 Bridge St, Fairhaven, MA 02719 and is currently estimated at $412,070, approximately $318 per square foot. 59 Bridge St is a home located in Bristol County with nearby schools including Fairhaven High School, City On A Hill Charter Public School New Bedford, and St. Joseph School.
Ownership History
Date
Name
Owned For
Owner Type
Purchase Details
Closed on
Apr 18, 2002
Sold by
Rivers Edge Dev Inc
Bought by
J C Hosford Constr Inc
Current Estimated Value
Purchase Details
Closed on
Dec 1, 1994
Sold by
New Bedford Inst Svgs
Bought by
Wunschel Steven P and Wunschel Elaine C
Purchase Details
Closed on
May 11, 1994
Sold by
Botelho James
Bought by
New Bedford Inst Svgs
Purchase Details
Closed on
May 12, 1987
Sold by
Fortunato B
Bought by
Botelho James
Create a Home Valuation Report for This Property
The Home Valuation Report is an in-depth analysis detailing your home's value as well as a comparison with similar homes in the area
Home Values in the Area
Average Home Value in this Area
Purchase History
| Date | Buyer | Sale Price | Title Company |
|---|---|---|---|
| J C Hosford Constr Inc | $140,000 | -- | |
| Wunschel Steven P | $62,000 | -- | |
| New Bedford Inst Svgs | $50,000 | -- | |
| Botelho James | $90,000 | -- |
Source: Public Records
Mortgage History
| Date | Status | Borrower | Loan Amount |
|---|---|---|---|
| Open | Botelho James | $194,500 | |
| Closed | Botelho James | $180,000 |
Source: Public Records
Tax History
| Year | Tax Paid | Tax Assessment Tax Assessment Total Assessment is a certain percentage of the fair market value that is determined by local assessors to be the total taxable value of land and additions on the property. | Land | Improvement |
|---|---|---|---|---|
| 2025 | $32 | $338,200 | $168,600 | $169,600 |
| 2024 | $3,038 | $329,100 | $168,600 | $160,500 |
| 2023 | $2,963 | $297,800 | $147,700 | $150,100 |
| 2022 | $2,870 | $280,800 | $137,200 | $143,600 |
| 2021 | $2,725 | $241,400 | $124,100 | $117,300 |
| 2020 | $2,515 | $227,400 | $124,100 | $103,300 |
| 2019 | $2,912 | $197,700 | $103,000 | $94,700 |
| 2018 | $2,212 | $187,300 | $98,000 | $89,300 |
| 2017 | $2,587 | $180,700 | $98,000 | $82,700 |
| 2016 | $2,108 | $173,100 | $98,000 | $75,100 |
| 2015 | $2,087 | $171,800 | $98,000 | $73,800 |
Source: Public Records
Map
Nearby Homes
- 67 Bridge St
- 39 Christian St
- 77 Adams St
- 138 Main St Unit 13
- 78 Middle St
- 145 Pleasant St
- 54 William St
- 48 Bellevue St
- 58 Washington St
- 15 School St
- 132 Pleasant St
- 48 Elm Ave
- 0 Nulands Neck Unit 73286360
- 8 Washington St
- 24 Middle St
- 61 Oxford St
- 70 Chestnut St
- 181 Washington St
- 8 Manor Dr
- 11 Lawton St
Your Personal Tour Guide
Ask me questions while you tour the home.