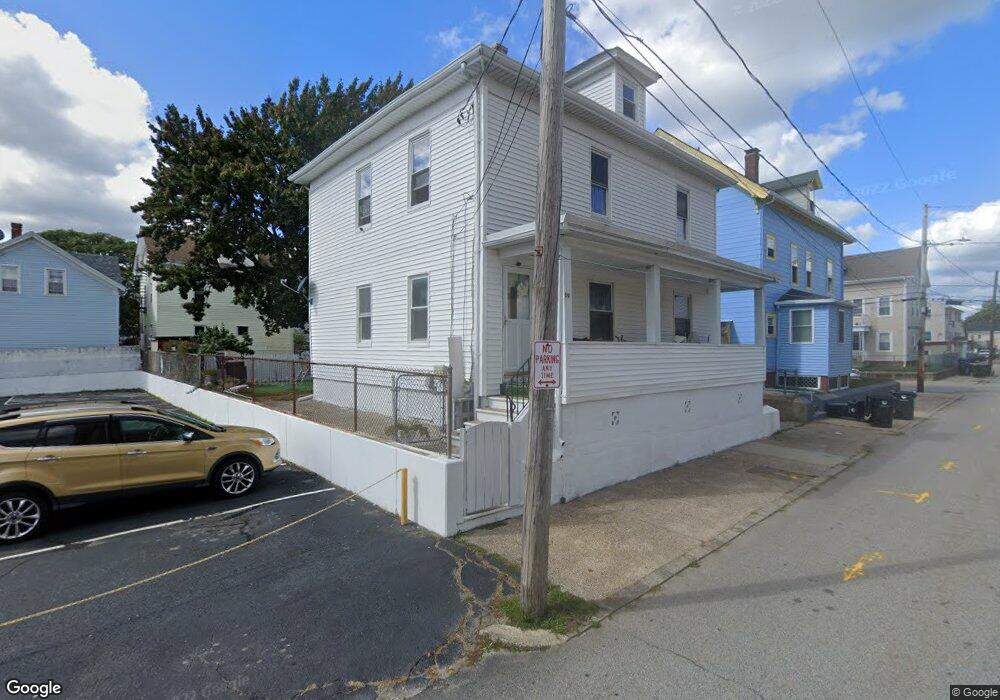
59 Bullock St Pawtucket, RI 02860
Downtown Pawtucket NeighborhoodEstimated Value: $338,000 - $384,936
4
Beds
2
Baths
1,560
Sq Ft
$238/Sq Ft
Est. Value
About This Home
This home is located at 59 Bullock St, Pawtucket, RI 02860 and is currently estimated at $370,984, approximately $237 per square foot. 59 Bullock St is a home located in Providence County with nearby schools including International Charter School, Blackstone Valley Prep Junior High School, and Blackstone Academy Charter School.
Ownership History
Date
Name
Owned For
Owner Type
Purchase Details
Closed on
Dec 30, 1992
Sold by
Pawtucket Cu
Bought by
Ciccia Ggiusseppe
Current Estimated Value
Create a Home Valuation Report for This Property
The Home Valuation Report is an in-depth analysis detailing your home's value as well as a comparison with similar homes in the area
Home Values in the Area
Average Home Value in this Area
Purchase History
| Date | Buyer | Sale Price | Title Company |
|---|---|---|---|
| Ciccia Ggiusseppe | $62,000 | -- |
Source: Public Records
Mortgage History
| Date | Status | Borrower | Loan Amount |
|---|---|---|---|
| Open | Ciccia Ggiusseppe | $27,000 | |
| Closed | Ciccia Ggiusseppe | $14,595 | |
| Closed | Ciccia Ggiusseppe | $22,000 | |
| Closed | Ciccia Ggiusseppe | $50,830 |
Source: Public Records
Tax History
| Year | Tax Paid | Tax Assessment Tax Assessment Total Assessment is a certain percentage of the fair market value that is determined by local assessors to be the total taxable value of land and additions on the property. | Land | Improvement |
|---|---|---|---|---|
| 2025 | $3,545 | $269,600 | $104,500 | $165,100 |
| 2024 | $3,327 | $269,600 | $104,500 | $165,100 |
| 2023 | $3,485 | $205,700 | $47,000 | $158,700 |
| 2022 | $3,411 | $205,700 | $47,000 | $158,700 |
| 2021 | $3,411 | $205,700 | $47,000 | $158,700 |
| 2020 | $3,393 | $162,400 | $47,600 | $114,800 |
| 2019 | $3,393 | $162,400 | $47,600 | $114,800 |
| 2018 | $3,269 | $162,400 | $47,600 | $114,800 |
| 2017 | $3,392 | $149,300 | $38,000 | $111,300 |
| 2016 | $3,268 | $149,300 | $38,000 | $111,300 |
| 2015 | $3,268 | $149,300 | $38,000 | $111,300 |
| 2014 | $3,593 | $155,800 | $48,900 | $106,900 |
Source: Public Records
Map
Nearby Homes
- 104 Capital St
- 98 Capital St
- 108 Capital St Unit 1
- 108 Capital St Unit 3
- 108 Capital St Unit 1
- 110 Capital St Unit B
- 110 Capital St Unit 2
- 110 Capital St Unit 1
- 91 Quincy Ave
- 103 Capital St
- 99 Capital St
- 95 Quincy Ave
- 159 Lonsdale Ave
- 109 Capital St
- 42 Bullock St
- 151 Lonsdale Ave
- 87 Capital St
- 87 Capital St
- 87 Capital St Unit 2
- 244 Harrison St
Your Personal Tour Guide
Ask me questions while you tour the home.