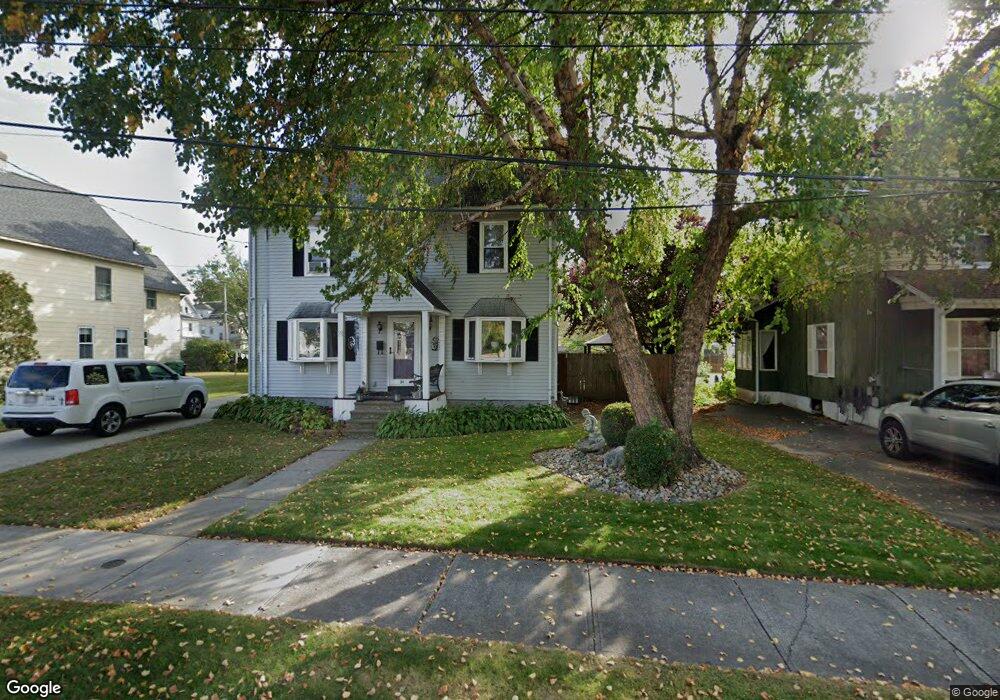
59 Charles St Chicopee, MA 01020
Chicopee Falls NeighborhoodEstimated Value: $294,000 - $378,326
5
Beds
2
Baths
1,752
Sq Ft
$193/Sq Ft
Est. Value
About This Home
This home is located at 59 Charles St, Chicopee, MA 01020 and is currently estimated at $337,582, approximately $192 per square foot. 59 Charles St is a home located in Hampden County with nearby schools including Belcher Elementary School, Bellamy Middle School, and Chicopee High School.
Ownership History
Date
Name
Owned For
Owner Type
Purchase Details
Closed on
Nov 2, 2020
Sold by
Colby Christopher M
Bought by
Colby Christopher M and Colby Shauna A
Current Estimated Value
Purchase Details
Closed on
Sep 29, 2010
Sold by
Larace Glenn S and Larace Angela D
Bought by
Colby Christopher M
Home Financials for this Owner
Home Financials are based on the most recent Mortgage that was taken out on this home.
Original Mortgage
$182,541
Interest Rate
4.5%
Mortgage Type
FHA
Purchase Details
Closed on
May 28, 1999
Sold by
Hines David R and Hines Deborah A
Bought by
Larace Glenn S and Larace Angela D
Home Financials for this Owner
Home Financials are based on the most recent Mortgage that was taken out on this home.
Original Mortgage
$118,450
Interest Rate
6.82%
Mortgage Type
Purchase Money Mortgage
Create a Home Valuation Report for This Property
The Home Valuation Report is an in-depth analysis detailing your home's value as well as a comparison with similar homes in the area
Home Values in the Area
Average Home Value in this Area
Purchase History
| Date | Buyer | Sale Price | Title Company |
|---|---|---|---|
| Colby Christopher M | -- | None Available | |
| Colby Christopher M | $185,000 | -- | |
| Larace Glenn S | $115,000 | -- |
Source: Public Records
Mortgage History
| Date | Status | Borrower | Loan Amount |
|---|---|---|---|
| Previous Owner | Colby Christopher M | $182,541 | |
| Previous Owner | Larace Glenn S | $118,450 | |
| Previous Owner | Larace Glenn S | $9,600 | |
| Previous Owner | Larace Glenn S | $86,000 |
Source: Public Records
Tax History Compared to Growth
Tax History
| Year | Tax Paid | Tax Assessment Tax Assessment Total Assessment is a certain percentage of the fair market value that is determined by local assessors to be the total taxable value of land and additions on the property. | Land | Improvement |
|---|---|---|---|---|
| 2025 | $3,905 | $257,600 | $82,400 | $175,200 |
| 2024 | $3,706 | $251,100 | $80,800 | $170,300 |
| 2023 | $3,485 | $230,000 | $73,400 | $156,600 |
| 2022 | $3,345 | $196,900 | $63,900 | $133,000 |
| 2021 | $5,552 | $176,600 | $54,800 | $121,800 |
| 2020 | $5,598 | $172,300 | $54,800 | $117,500 |
| 2019 | $2,956 | $164,600 | $54,800 | $109,800 |
| 2018 | $5,523 | $156,800 | $52,200 | $104,600 |
| 2017 | $2,652 | $153,200 | $46,600 | $106,600 |
| 2016 | $2,785 | $164,700 | $46,600 | $118,100 |
| 2015 | $2,829 | $161,300 | $46,600 | $114,700 |
| 2014 | $1,415 | $161,300 | $46,600 | $114,700 |
Source: Public Records
Map
Nearby Homes
- 53 Charles St
- 67 Charles St
- 22 Yale St
- 45 Charles St
- 18 Yale St Unit 1
- 58 Charles St
- 76 Southwick St
- 8 Yale St
- 48 Southwick St
- 75 Charles St
- 16 Yale St
- 50 Charles St
- 2 Yale St
- 39 Charles St
- 39 Charles St Unit 1
- 41 Charles St Unit 1st Fl.
- 71 Southwick St
- 51 Southwick St Unit 2L
- 51 Southwick St
- 0 None Unit 71621658