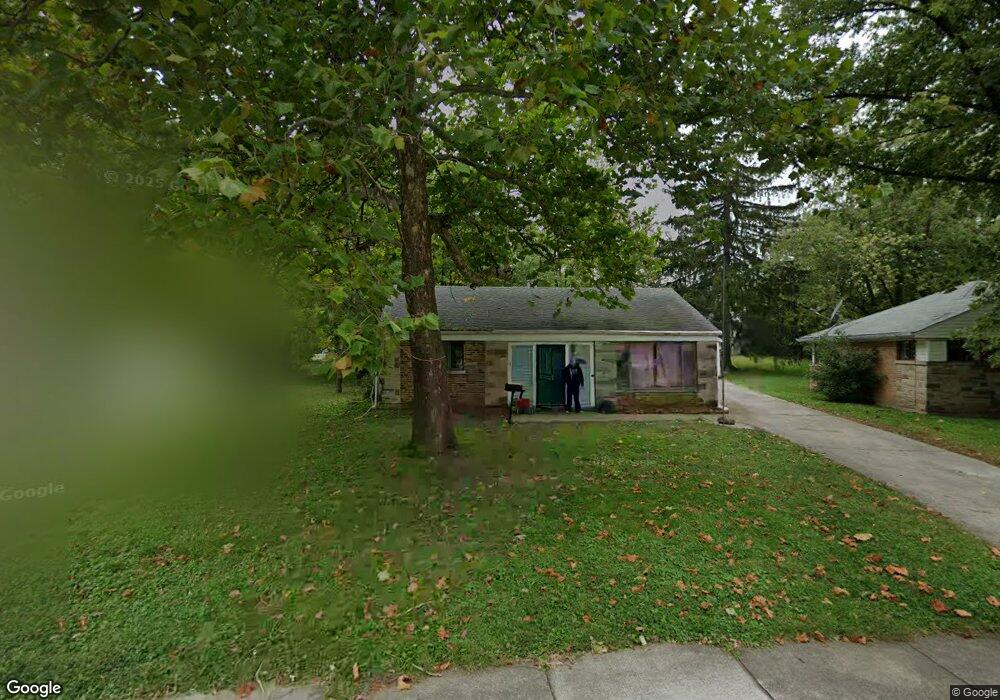
59 Cherry St Park Forest, IL 60466
Estimated Value: $152,000 - $204,000
3
Beds
2
Baths
1,588
Sq Ft
$106/Sq Ft
Est. Value
About This Home
This home is located at 59 Cherry St, Park Forest, IL 60466 and is currently estimated at $169,098, approximately $106 per square foot. 59 Cherry St is a home located in Cook County with nearby schools including 21st Century Primary Center, Blackhawk Intermediate Center, and Michelle Obama School of Technology.
Ownership History
Date
Name
Owned For
Owner Type
Purchase Details
Closed on
Sep 9, 2012
Sold by
Metzger Thomas R and Metzger Barbara L
Bought by
Castle Ridge Builders Llc
Current Estimated Value
Purchase Details
Closed on
Apr 25, 2005
Sold by
Metzger Thomas
Bought by
Metzger Thomas and Metzger Barbara
Home Financials for this Owner
Home Financials are based on the most recent Mortgage that was taken out on this home.
Original Mortgage
$96,500
Interest Rate
6.75%
Mortgage Type
New Conventional
Purchase Details
Closed on
Oct 13, 2003
Sold by
Metzger Barbara L
Bought by
Metzger Thomas
Purchase Details
Closed on
Feb 24, 1995
Sold by
Gomes Tyrone V and Gomes Cecelia C
Bought by
Metzger Barbara L
Home Financials for this Owner
Home Financials are based on the most recent Mortgage that was taken out on this home.
Original Mortgage
$78,550
Interest Rate
7.5%
Mortgage Type
FHA
Create a Home Valuation Report for This Property
The Home Valuation Report is an in-depth analysis detailing your home's value as well as a comparison with similar homes in the area
Home Values in the Area
Average Home Value in this Area
Purchase History
| Date | Buyer | Sale Price | Title Company |
|---|---|---|---|
| Castle Ridge Builders Llc | $18,000 | Fidelity National Title Insu | |
| Metzger Thomas | -- | Ticor Title Insurance Compan | |
| Metzger Thomas | -- | -- | |
| Metzger Barbara L | $80,500 | -- |
Source: Public Records
Mortgage History
| Date | Status | Borrower | Loan Amount |
|---|---|---|---|
| Previous Owner | Metzger Thomas | $96,500 | |
| Previous Owner | Metzger Barbara L | $78,550 |
Source: Public Records
Tax History
| Year | Tax Paid | Tax Assessment Tax Assessment Total Assessment is a certain percentage of the fair market value that is determined by local assessors to be the total taxable value of land and additions on the property. | Land | Improvement |
|---|---|---|---|---|
| 2025 | $10,248 | $14,000 | $2,836 | $11,164 |
| 2024 | $8,061 | $14,000 | $2,836 | $11,164 |
| 2023 | $8,061 | $14,000 | $2,836 | $11,164 |
| 2022 | $8,061 | $5,996 | $2,634 | $3,362 |
| 2021 | $7,910 | $5,995 | $2,633 | $3,362 |
| 2020 | $7,212 | $5,995 | $2,633 | $3,362 |
| 2019 | $8,472 | $7,784 | $2,431 | $5,353 |
| 2018 | $8,165 | $7,784 | $2,431 | $5,353 |
| 2017 | $8,115 | $7,784 | $2,431 | $5,353 |
| 2016 | $7,046 | $7,087 | $2,228 | $4,859 |
| 2015 | $6,885 | $7,087 | $2,228 | $4,859 |
| 2014 | $6,683 | $7,087 | $2,228 | $4,859 |
| 2013 | $6,309 | $7,468 | $2,228 | $5,240 |
Source: Public Records
Map
Nearby Homes
- 55 Apple Ln
- 226 S Orchard Dr
- 223 S Orchard Dr
- 74 Marquette St
- 22 Apple Ln
- 62 Marquette St
- 154 Hemlock St Unit 912
- 141 Hemlock St Unit 253
- 310 Nassau St
- 55 Marquette St
- 17 Oak Ln
- 308 Oakwood St
- 131 Sauk Trail
- 5 Oak Ln
- 239 Indianwood Blvd
- 241 Indianwood Blvd
- 332 Oswego St
- 142 Marquette St
- 307 Osage St
- 336 Oakwood St
Your Personal Tour Guide
Ask me questions while you tour the home.