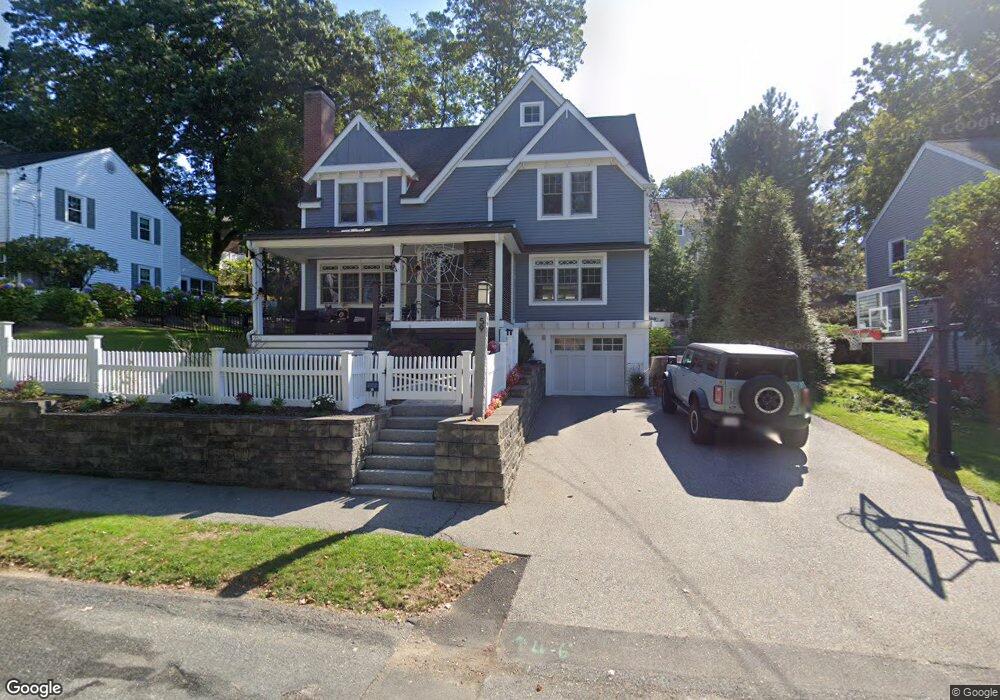
59 Concord St Needham Heights, MA 02494
Estimated Value: $1,141,000 - $1,435,574
3
Beds
3
Baths
1,512
Sq Ft
$855/Sq Ft
Est. Value
About This Home
This home is located at 59 Concord St, Needham Heights, MA 02494 and is currently estimated at $1,292,894, approximately $855 per square foot. 59 Concord St is a home located in Norfolk County with nearby schools including Mitchell Elementary School, High Rock Middle School, and Pollard Middle School.
Ownership History
Date
Name
Owned For
Owner Type
Purchase Details
Closed on
Nov 24, 2009
Sold by
Dippert Rt and Dippert William H
Bought by
Defeo Annamarie and Defeo James W
Current Estimated Value
Home Financials for this Owner
Home Financials are based on the most recent Mortgage that was taken out on this home.
Original Mortgage
$478,669
Outstanding Balance
$311,574
Interest Rate
4.86%
Mortgage Type
Purchase Money Mortgage
Estimated Equity
$981,320
Purchase Details
Closed on
Aug 12, 2009
Sold by
Dippert Inza M
Bought by
Dippert Rt and Dippert Inza M
Create a Home Valuation Report for This Property
The Home Valuation Report is an in-depth analysis detailing your home's value as well as a comparison with similar homes in the area
Home Values in the Area
Average Home Value in this Area
Purchase History
| Date | Buyer | Sale Price | Title Company |
|---|---|---|---|
| Defeo Annamarie | $487,500 | -- | |
| Dippert Rt | -- | -- |
Source: Public Records
Mortgage History
| Date | Status | Borrower | Loan Amount |
|---|---|---|---|
| Open | Defeo Annamarie | $478,669 |
Source: Public Records
Tax History
| Year | Tax Paid | Tax Assessment Tax Assessment Total Assessment is a certain percentage of the fair market value that is determined by local assessors to be the total taxable value of land and additions on the property. | Land | Improvement |
|---|---|---|---|---|
| 2025 | $12,502 | $1,179,400 | $752,500 | $426,900 |
| 2024 | $12,705 | $1,014,800 | $565,700 | $449,100 |
| 2023 | $12,797 | $981,400 | $565,700 | $415,700 |
| 2022 | $12,347 | $923,500 | $523,800 | $399,700 |
| 2021 | $12,033 | $923,500 | $523,800 | $399,700 |
| 2020 | $11,713 | $937,800 | $524,200 | $413,600 |
| 2019 | $10,975 | $885,800 | $476,600 | $409,200 |
| 2018 | $10,523 | $885,800 | $476,600 | $409,200 |
| 2017 | $9,913 | $833,700 | $476,600 | $357,100 |
| 2016 | $7,240 | $627,400 | $476,600 | $150,800 |
| 2015 | $7,083 | $627,400 | $476,600 | $150,800 |
| 2014 | $6,544 | $562,200 | $414,400 | $147,800 |
Source: Public Records
Map
Nearby Homes
- 55 Burnside Rd
- 28 Mercer Rd
- 7 West St
- 17 Lindbergh Ave
- 100 Woodbine Cir
- 143 Hunting Rd
- 108 Woodbine Cir
- 510 Webster St
- 5 Hazel Ln
- 24 Mellen St
- 58 Morton St
- 5 Sachem Rd
- 190 Brookline St
- 11 Holmes St
- 132 Hillside Ave
- 134 Hillside Ave Unit 134
- 218 Hillside Ave
- 140 Hillside Ave
- 140 Hillside Ave Unit a
- 385 Hillside Ave
- 55 Concord St
- 67 Concord St
- 128 Lexington Ave
- 120 Lexington Ave
- 45 Bennington St
- 51 Concord St
- 61 Tower Ave
- 73 Concord St
- 44 Bennington St
- 40 Burnside Rd
- 58 Burnside Rd
- 127 Lexington Ave
- 102 Lexington Ave
- 37 Bennington St
- 115 Lexington Ave
- 38 Bennington St
- 35 Tower Ave
- 34 Burnside Rd
- 56 Tower Ave
- 56 Tower Ave Unit 56
Your Personal Tour Guide
Ask me questions while you tour the home.