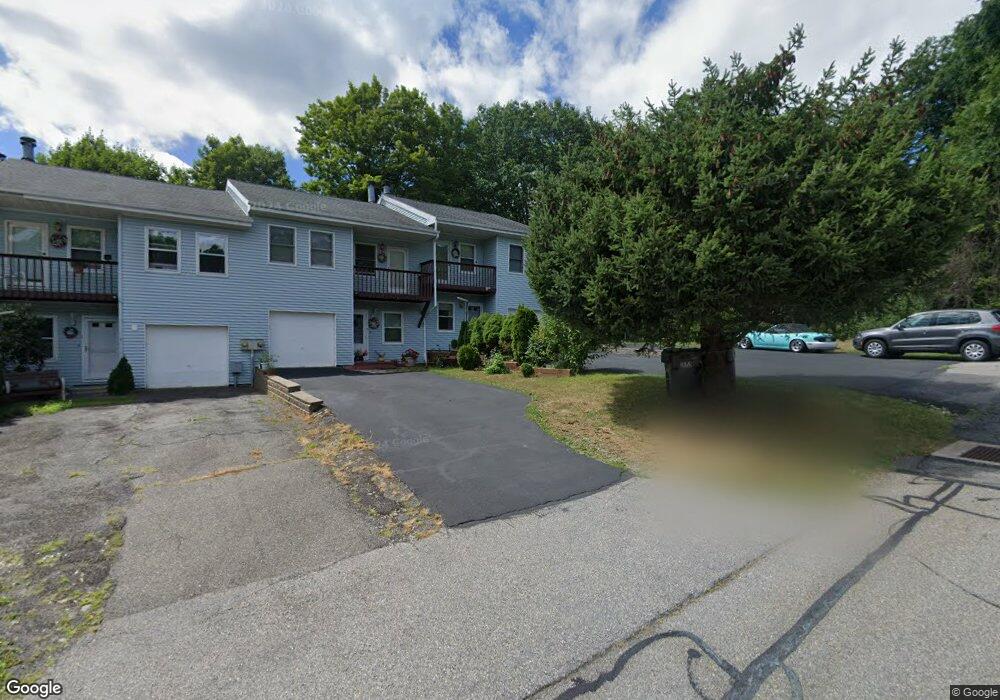
59 Cook St Unit 1 Winsted, CT 06098
Estimated Value: $140,000 - $258,000
2
Beds
2
Baths
960
Sq Ft
$190/Sq Ft
Est. Value
About This Home
This home is located at 59 Cook St Unit 1, Winsted, CT 06098 and is currently estimated at $182,840, approximately $190 per square foot. 59 Cook St Unit 1 is a home located in Litchfield County with nearby schools including Explorations Charter School, St Anthony School, and The Gilbert School.
Ownership History
Date
Name
Owned For
Owner Type
Purchase Details
Closed on
Nov 3, 2020
Sold by
Lavieri Ann B
Bought by
Kruk Magdalena and Biraga Krzysztof
Current Estimated Value
Purchase Details
Closed on
Mar 31, 1999
Sold by
Closson Janet L
Bought by
Lavieri Ann B
Home Financials for this Owner
Home Financials are based on the most recent Mortgage that was taken out on this home.
Original Mortgage
$53,600
Interest Rate
6.78%
Purchase Details
Closed on
Jul 12, 1996
Sold by
Leemonn Emil F
Bought by
Closson Janet L
Create a Home Valuation Report for This Property
The Home Valuation Report is an in-depth analysis detailing your home's value as well as a comparison with similar homes in the area
Home Values in the Area
Average Home Value in this Area
Purchase History
| Date | Buyer | Sale Price | Title Company |
|---|---|---|---|
| Kruk Magdalena | -- | None Available | |
| Kruk Magdalena | -- | None Available | |
| Lavieri Ann B | $54,900 | -- | |
| Lavieri Ann B | $54,900 | -- | |
| Closson Janet L | $25,000 | -- | |
| Closson Janet L | $25,000 | -- |
Source: Public Records
Mortgage History
| Date | Status | Borrower | Loan Amount |
|---|---|---|---|
| Previous Owner | Closson Janet L | $83,200 | |
| Previous Owner | Closson Janet L | $53,600 | |
| Closed | Closson Janet L | $4,400 |
Source: Public Records
Tax History Compared to Growth
Tax History
| Year | Tax Paid | Tax Assessment Tax Assessment Total Assessment is a certain percentage of the fair market value that is determined by local assessors to be the total taxable value of land and additions on the property. | Land | Improvement |
|---|---|---|---|---|
| 2025 | $2,081 | $71,330 | $0 | $71,330 |
| 2024 | $1,943 | $71,330 | $0 | $71,330 |
| 2023 | $1,882 | $71,330 | $0 | $71,330 |
| 2022 | $1,817 | $54,180 | $0 | $54,180 |
| 2021 | $1,817 | $54,180 | $0 | $54,180 |
| 2020 | $1,817 | $54,180 | $0 | $54,180 |
| 2019 | $1,817 | $54,180 | $0 | $54,180 |
| 2018 | $1,817 | $54,180 | $0 | $54,180 |
| 2017 | $2,132 | $63,560 | $0 | $63,560 |
| 2016 | $2,132 | $63,560 | $0 | $63,560 |
| 2015 | $2,078 | $63,560 | $0 | $63,560 |
| 2014 | $2,028 | $63,560 | $0 | $63,560 |
Source: Public Records
Map
Nearby Homes